Here is a detailed daily technical analysis and forecast for EURUSD, USDJPY, GBPUSD, AUDUSD, USDCAD, XAUUSD, and Brent for 18 April 2025.
EURUSD forecast
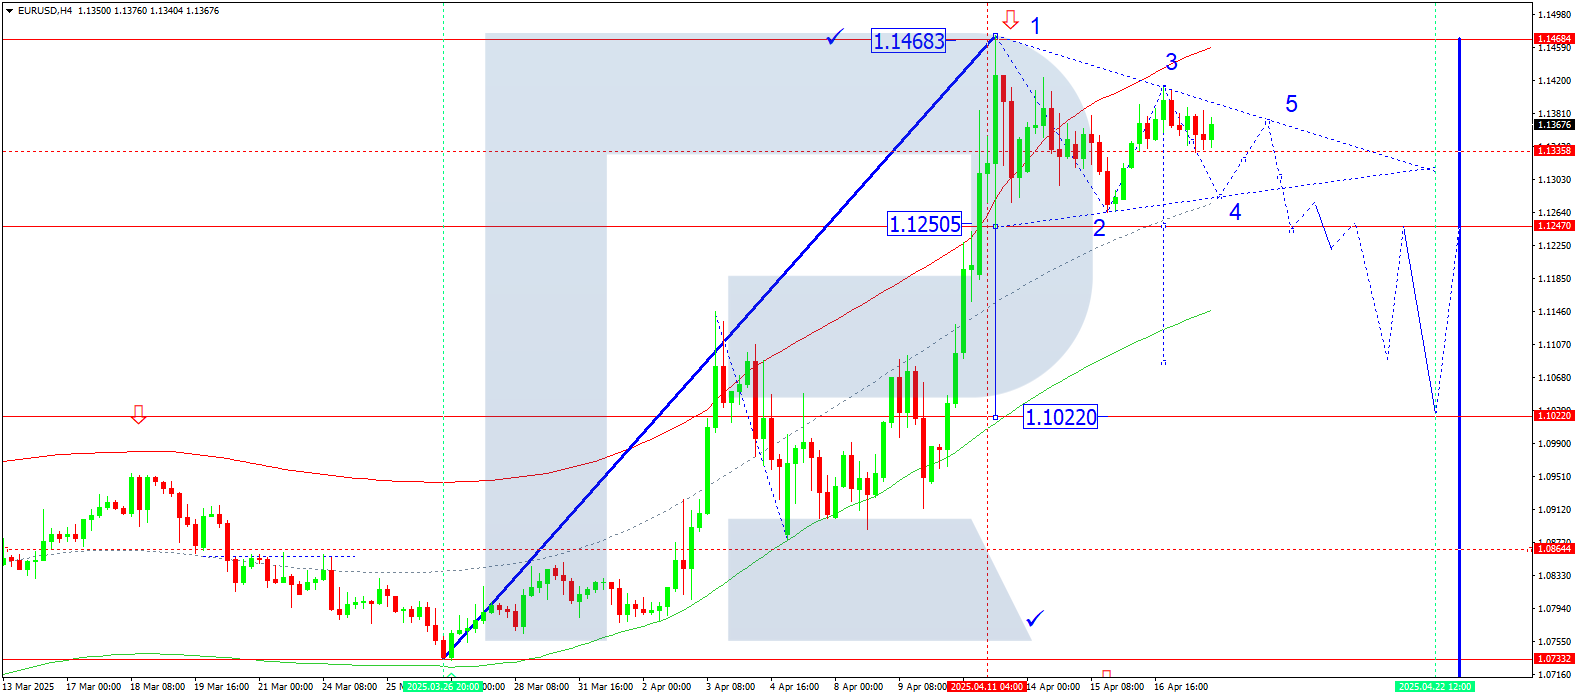
On the H4 chart, EURUSD continues to develop a consolidation range in the form of a Triangle. Today, 18 April 2025, the price may decline towards the lower boundary of the Triangle at 1.1298. Afterwards, another upward leg to 1.1373 is possible. Once both structures are complete, the pair may break out downward from this technical pattern, aiming for 1.1250 with a potential trend continuation to 1.1080 — a local target.
Technically, this scenario is supported by the Elliott wave structure and the growth wave matrix with a pivot at 1.1190, considered the key level in this wave structure. The market had previously reached the upper boundary of the Price Envelope at 1.1468. The current consolidation range is forming as a reversal Triangle. A drop to its central line at 1.1250 remains relevant.
Technical indicators for today’s EURUSD forecast suggest a continued decline towards 1.1250.
.png)
USDJPY forecast
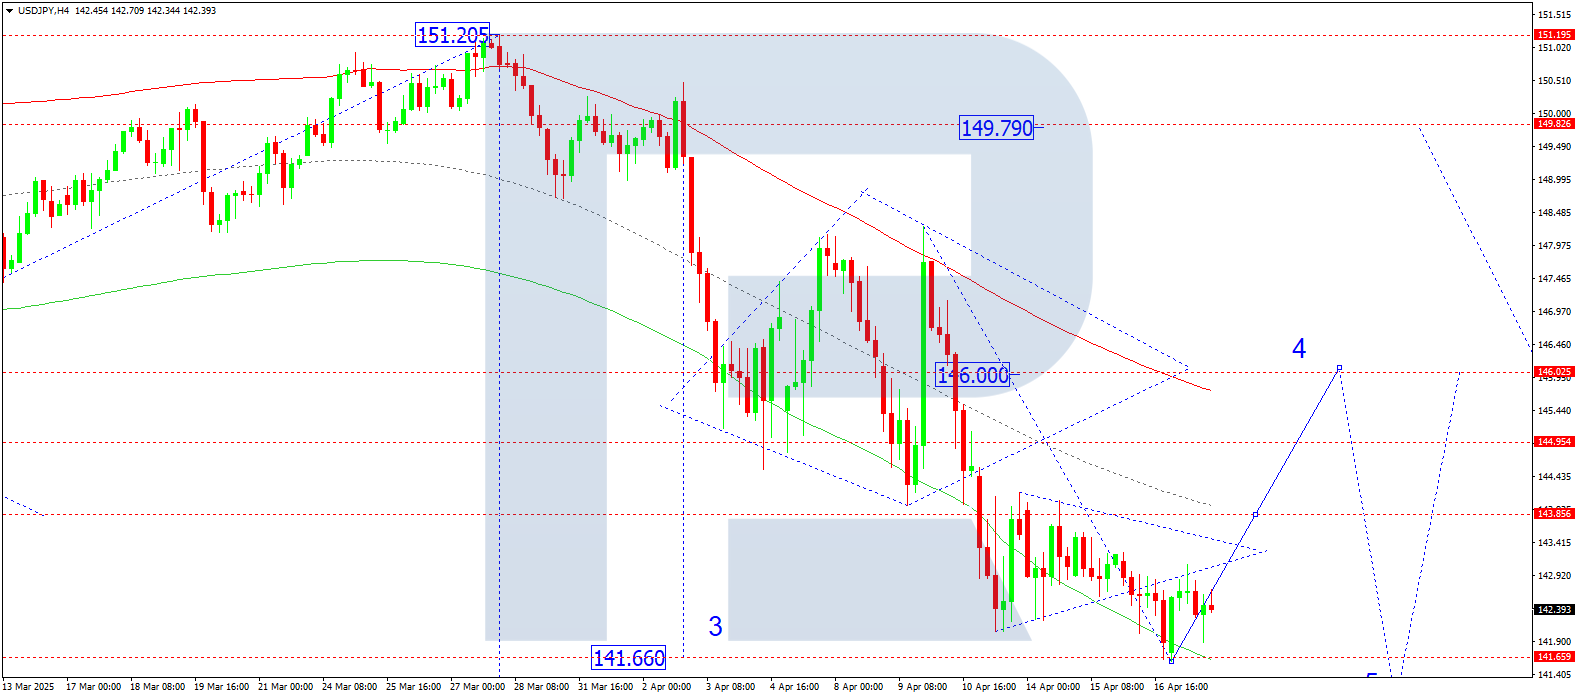
On the H4 chart, USDJPY completed a growth impulse to 143.07 and a correction to 141.90. Today, 18 April 2025, a new growth wave towards 145.00 is possible, with a further extension to 146.00. Afterwards, a decline to 141.00 is expected — the main target.
Technically, the scenario is supported by the Elliott wave structure and the downward wave matrix with a pivot at 146.00, viewed as key in this wave. The market previously completed the third wave down to the lower boundary of the Price Envelope at 141.66. Today, a move up to the central line at 145.00 is likely, with a potential continuation to the upper boundary at 146.00. A subsequent decline towards 141.00 remains relevant.
Technical indicators for today’s USDJPY forecast suggest a rise towards 145.00.
GBPUSD forecast
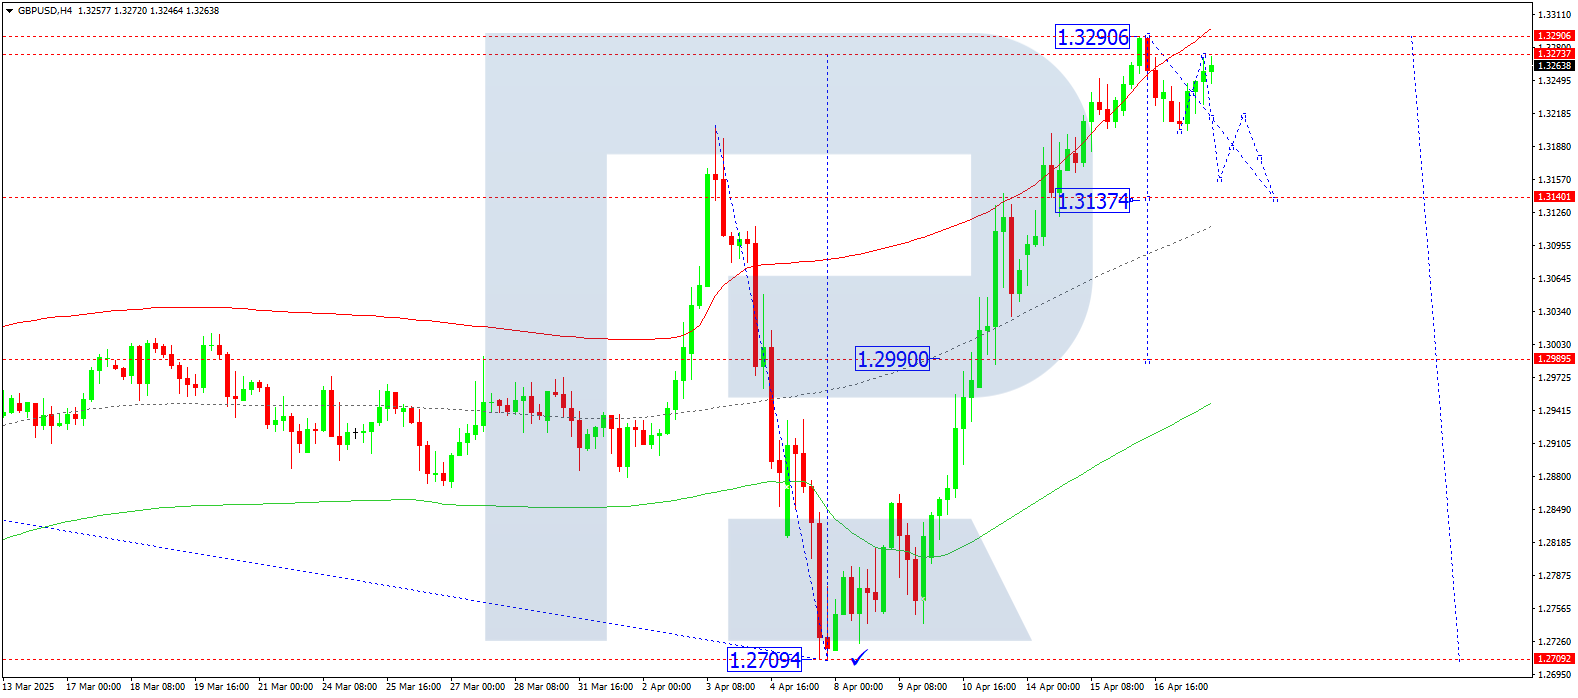
On the H4 chart, GBPUSD completed a decline to 1.3200 and a correction to 1.3270. Today, 18 April 2025, a further decline to 1.3137 is expected. A short correction to 1.3200 may follow, after which the market may resume its decline to 1.2990.
Technically, the Elliott wave structure and the growth wave matrix with a pivot at 1.2990 confirm this scenario, with this level seen as key in the current wave. The price previously moved to the upper boundary of the Price Envelope at 1.3290. A drop to the central line at 1.3137 is now anticipated.
Technical indicators for today’s GBPUSD forecast suggest the beginning of a decline towards 1.3137.
AUDUSD forecast
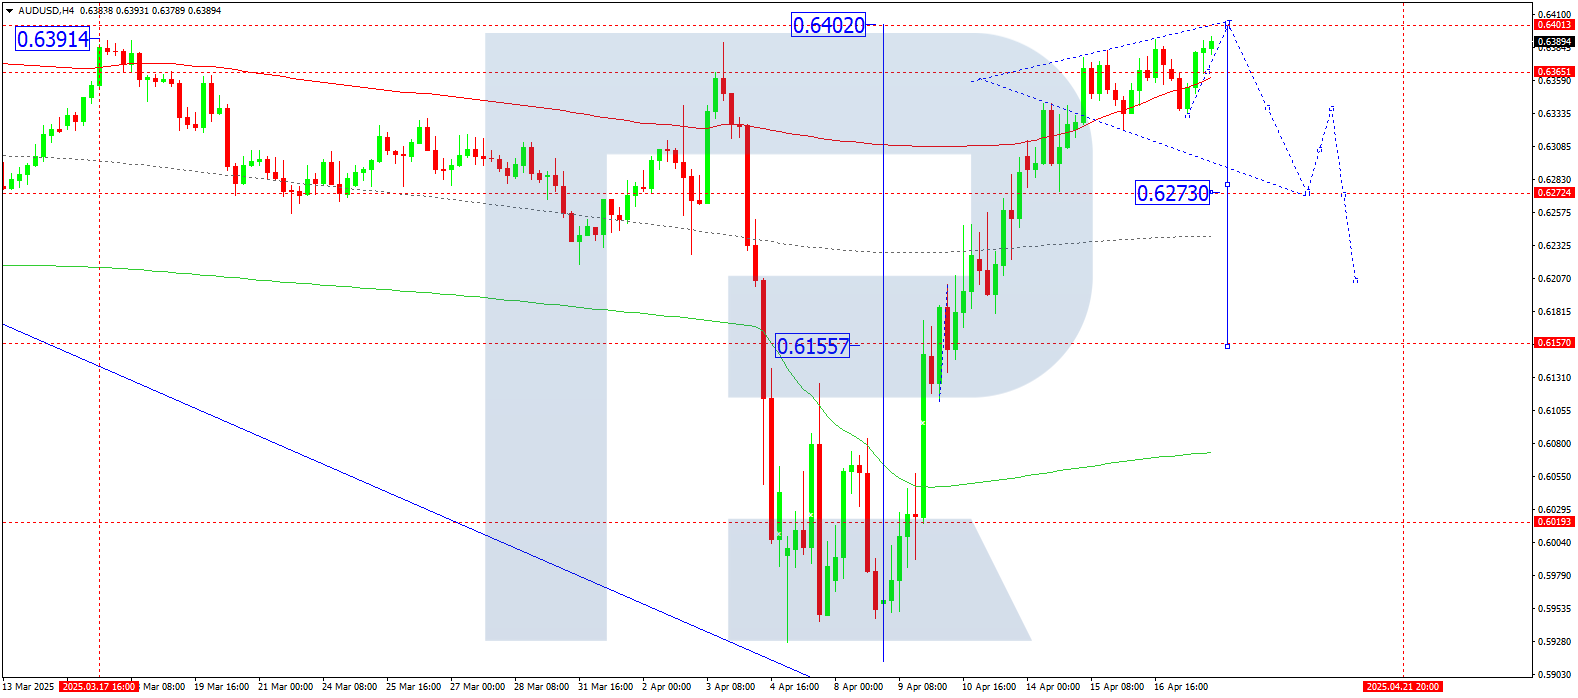
On the H4 chart, AUDUSD is forming a consolidation range around 0.6363. Today, 18 April 2025, the range may expand upwards towards 0.6400. Then, a decline to 0.6273 could follow, with a possible continuation of the wave towards 0.6150 — the first target.
Technically, the scenario is confirmed by the Elliott wave structure and the growth wave matrix with a pivot at 0.6150, considered key in this wave structure. The market previously completed a wave to the upper boundary of the Price Envelope at 0.6393. A drop to the central line at 0.6150 is possible.
Technical indicators for today’s AUDUSD forecast suggest a potential decline towards 0.6150.
USDCAD forecast
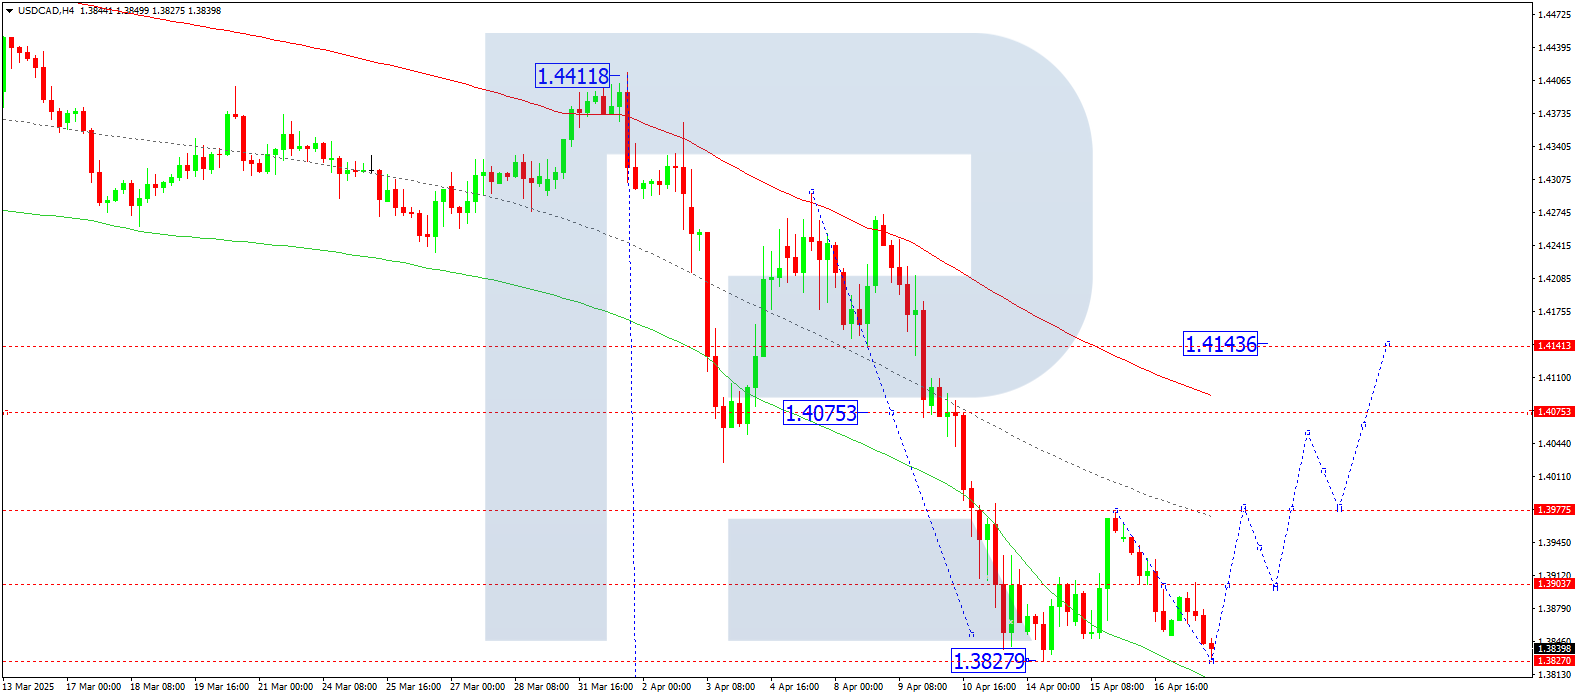
On the H4 chart, USDCAD continues to consolidate around 1.3900. Today, 18 April 2025, the price returned to the lower boundary of this range. A rise to the upper boundary is expected. If the price breaks above 1.3977, it could extend the wave to 1.4144.
Technically, the Elliott wave structure and the downward wave matrix with a pivot at 1.4075 support this scenario. This level is key in the current wave structure. The market had previously reached the lower boundary of the Price Envelope at 1.3830. A rise towards the central line at 1.4000 is now relevant.
Technical indicators for today’s USDCAD forecast suggest a move towards 1.4000.
XAUUSD forecast
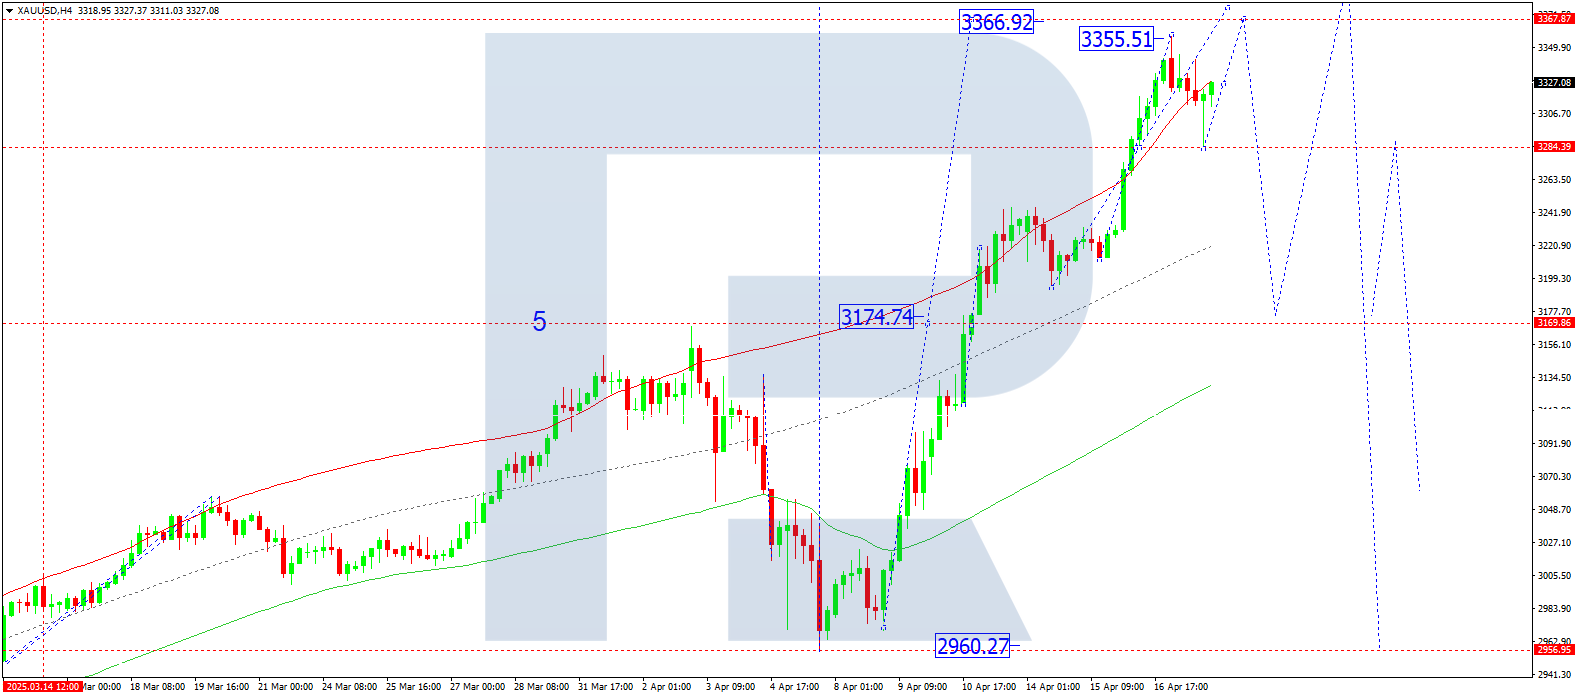
On the H4 chart, XAUUSD completed a growth wave to 3,355 and corrected to 3,284. Today, 18 April 2025, a new upward leg towards 3,366 is possible. Afterwards, the market may start a decline to 3,175.
Technically, the scenario is supported by the Elliott wave structure and the growth wave matrix with a pivot at 3,175. This level is considered key in the current wave. The market is currently moving towards the upper boundary of the Price Envelope at 3,366. After reaching this target, a reversal towards the central line at 3,280 may follow.
Technical indicators for today’s XAUUSD forecast suggest a rise to 3,366.
Brent forecast
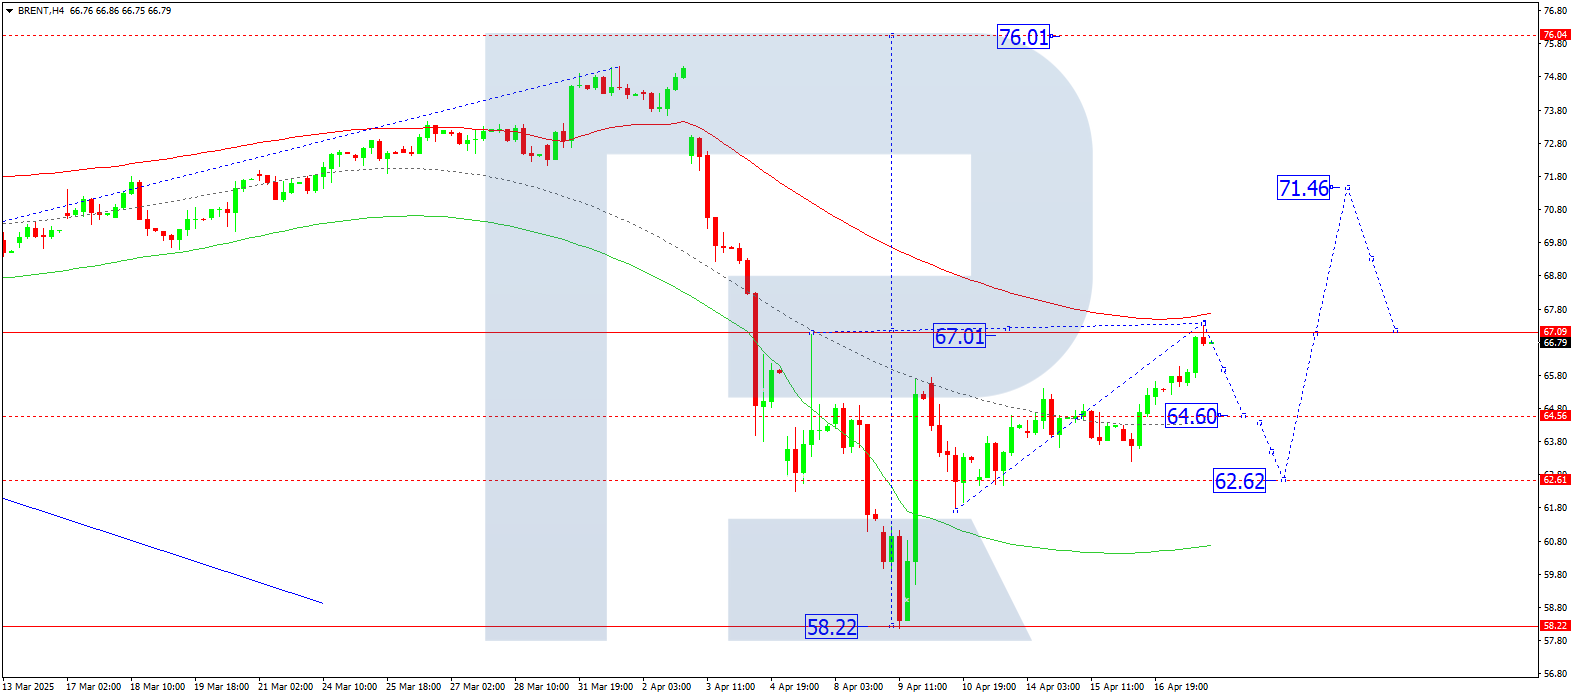
On the H4 chart, Brent crude reached 67.38. Today, 18 April 2025, a correction to 64.60 may develop. If the price breaks below this level, the wave may extend to 62.62. Afterwards, a rise towards 71.50 is possible — this is the local, calculated target.
Technically, this scenario is supported by the Elliott wave structure and the downward wave matrix with a pivot at 67.00. This level is key in the current wave structure for Brent. The market recently completed a wave to the upper boundary of the Price Envelope at 67.38. A correction to the central line at 64.60 is now expected.
Technical indicators for today’s Brent forecast suggest a correction towards 64.60.