Here is a detailed daily technical analysis and forecast for EURUSD, USDJPY, GBPUSD, AUDUSD, USDCAD, XAUUSD, and Brent for 21 April 2025.
EURUSD forecast
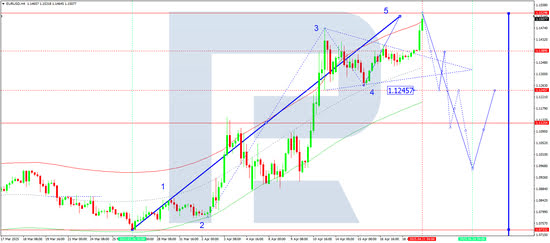
On the H4 chart, EURUSD broke out of the consolidation range upwards and, having received support at 1.1400, completed a growth wave to 1.1530. Today, 21 April 2025, a technical pullback to 1.1400 (testing from above) is possible. If this level breaks downward, the price may continue falling towards 1.1250 — the first target.
Technically, this scenario is confirmed by the Elliott wave structure and the growth wave matrix with a pivot at 1.1125, which is key in the current wave structure. The market has completed a wave to the upper boundary of the Price Envelope at 1.1530. A decline towards the lower boundary at 1.1250 remains likely.
Technical indicators for today’s EURUSD forecast suggest a possible beginning of a decline to 1.1250.
.png)
USDJPY forecast
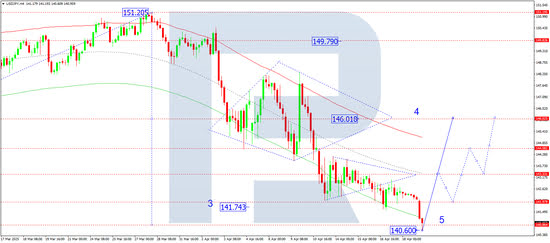
On the H4 chart, USDJPY completed a downward wave to 140.60. Today, 21 April 2025, a new upward wave towards 143.33 may begin, followed by a correction to 142.00. Then, the pair may resume growth to 144.55.
Technically, this scenario is supported by the Elliott wave structure and the downward wave matrix with a pivot at 146.00, which is key in this wave. The market previously completed the third wave of decline to the lower boundary of the Price Envelope at 140.60. A rise to the central line at 143.33 is likely, with potential for continuation to the upper boundary at 146.00.
Technical indicators for today’s USDJPY forecast suggest a wave of growth to 143.33.
GBPUSD forecast
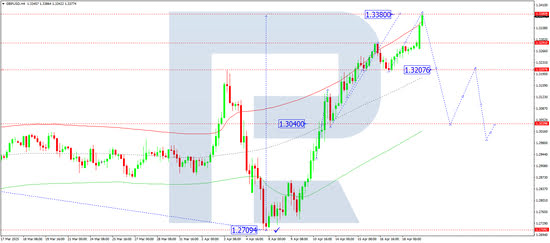
On the H4 chart, GBPUSD formed a consolidation range around 1.3200 and broke out upwards, completing a growth wave to 1.3380. Today, 21 April 2025, a downward move to 1.3290 is possible. If this level breaks, the wave may extend towards 1.3040.
Technically, this scenario is confirmed by the Elliott wave structure and the growth wave matrix with a pivot at 1.3040, which is key in this wave structure. The market reached the upper boundary of the Price Envelope at 1.3380. A decline towards the central line at 1.3200 remains relevant.
Technical indicators for today’s GBPUSD forecast suggest a downward wave to 1.3200.
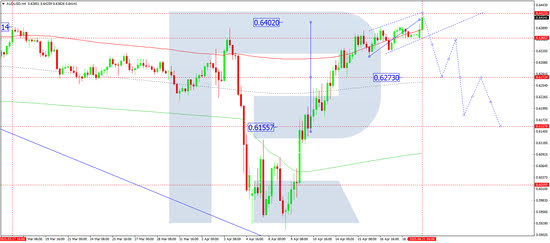
AUDUSD forecast
On the H4 chart, AUDUSD formed a consolidation range around 0.6363 and broke out upwards, completing a growth wave to 0.6422. Today, 21 April 2025, a downward wave to 0.6360 is expected. If the price breaks this level, it may continue falling to 0.6272 — the first target.
Technically, the scenario is confirmed by the Elliott wave structure and the growth wave matrix with a pivot at 0.6150, which remains key in this wave. The market has completed a wave to the upper boundary of the Price Envelope at 0.6422. A move towards the central line at 0.6272 is relevant.
Technical indicators for today’s AUDUSD forecast suggest a decline to 0.6272.
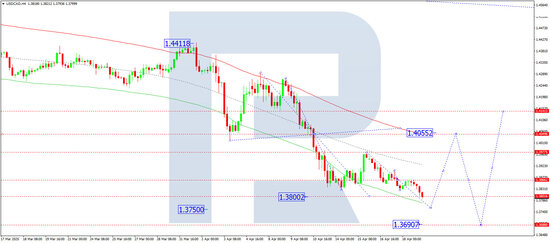
USDCAD forecast
On the H4 chart, USDCAD broke out of the consolidation range downward and completed a wave to 1.3800. Today, 21 April 2025, the wave may stretch further to 1.3750. Afterwards, a rise towards the upper boundary of the range at 1.4055 is possible. If this level is broken, the price may continue rising to 1.4144.
Technically, the Elliott wave structure and the downward wave matrix with a pivot at 1.4055 confirm this scenario. This level is key in the current wave. The market reached the lower boundary of the Price Envelope at 1.3800. A rebound towards the central line at 1.4000 is expected.
Technical indicators for today’s USDCAD forecast suggest a growth wave to 1.4055.
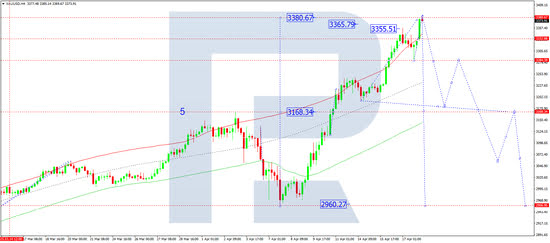
XAUUSD forecast
On the H4 chart, XAUUSD received support at 3,285 and completed a wave of growth to 3,380. Today, 21 April 2025, a decline towards 3,285 is expected. If the price breaks below this level, it may continue declining towards 3,170.
Technically, this scenario is confirmed by the Elliott wave structure and the growth wave matrix with a pivot at 3,170. This level is key in this wave structure for XAUUSD. The price has reached the upper boundary of the Price Envelope at 3,380. A move to the central line at 3,280 may follow.
Technical indicators for today’s XAUUSD forecast suggest a downward wave to 3,280.
Brent forecast
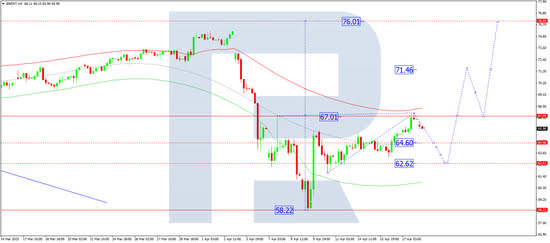
On the H4 chart, Brent crude completed a growth wave to 67.38. Today, 21 April 2025, a correction to 64.60 may follow. If the price breaks below this level, the wave may extend to 62.62. Afterwards, a rise to 71.50 may begin — this is the local projected target.
Technically, this scenario is confirmed by the Elliott wave structure and the downward wave matrix with a pivot at 67.00. This level is key for Brent in this wave. The market reached the upper boundary of the Price Envelope at 67.38. A correction towards the central line at 64.60 remains relevant.
Technical indicators in today’s Brent forecast suggest a corrective decline to 64.60.