Here is a detailed daily technical analysis and forecast for EURUSD, USDJPY, GBPUSD, AUDUSD, USDCAD, XAUUSD, and Brent for 26 February 2025.
EURUSD forecast
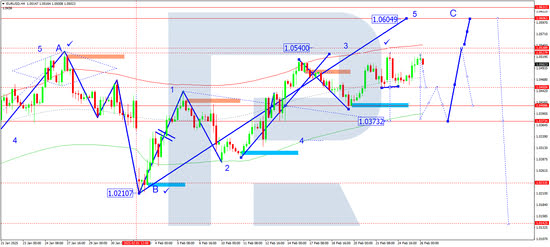
On the H4 chart, EURUSD completed a growth wave towards 1.0524. Today, 26 February 2025, the market is expected to decline towards 1.0450. If this level is broken, further downside towards 1.0380 may follow. Later, the price might retest 1.0450 from below before continuing the decline to 1.0375. Once this correction is completed, a new growth wave towards 1.0606 is anticipated.
Technically, this scenario aligns with the Elliott wave structure and the growth wave matrix, with a pivot point at 1.0400. The market is forming a consolidation range around 1.0450. A downward breakout may lead to a decline towards 1.0375, while an upward breakout could trigger a move towards 1.0540.
Technical indicators suggest a continued correction towards 1.0380.
.png)
USDJPY forecast
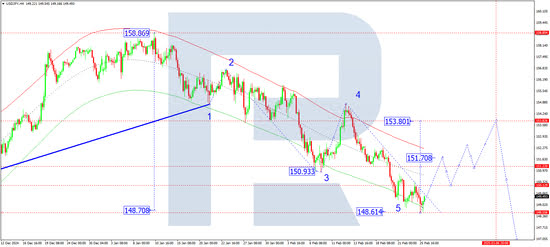
On the H4 chart, USDJPY completed a decline to 148.55. Today, 26 February 2025, the market is expected to start an upward move towards 150.10. If this level is broken, the price could continue rising towards 151.71.
Technically, this scenario is supported by the Elliott wave structure and the declining wave matrix, with a pivot point at 153.80. The market has reached the lower boundary of the price Envelope at 148.55, and the next expected move is a rise towards the central line at 150.10.
Technical indicators suggest the beginning of an upward wave towards 150.10.
GBPUSD forecast
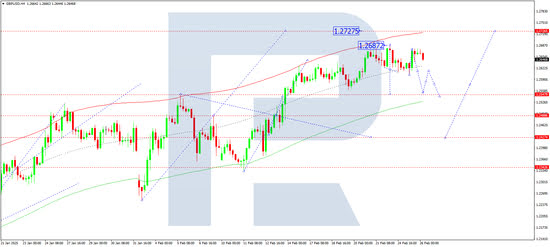
On the H4 chart, GBPUSD remains in a consolidation range around 1.2650. Today, 26 February 2025, the range has expanded to 1.2677. A downward breakout could trigger a correction towards 1.2555, with a further decline to 1.2545.
Technically, this scenario is supported by the Elliott wave structure and the growth wave matrix, with a pivot point at 1.2488. The market is consolidating above the central line of the price Envelope. If the price breaks downwards, it may decline towards 1.2545, while an upward breakout could extend the growth towards 1.2700, followed by a potential decline towards 1.2400.
Technical indicators suggest a correction towards 1.2545.
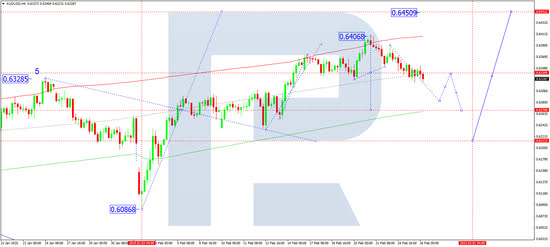
AUDUSD forecast
On the H4 chart, AUDUSD completed a decline towards 0.6333 and is now consolidating above this level. Today, 26 February 2025, a downward breakout is expected. If 0.6330 is broken, a correction towards 0.6270 could develop. After this correction, a growth wave towards 0.6450 is anticipated.
Technically, this scenario aligns with the Elliott wave structure and the growth wave matrix, with a pivot point at 0.6270. The market previously reached the upper boundary of the price Envelope at 0.6406. The next move is expected to be a correction towards the lower boundary at 0.6270.
Technical indicators suggest a continuation of the correction towards 0.6270.
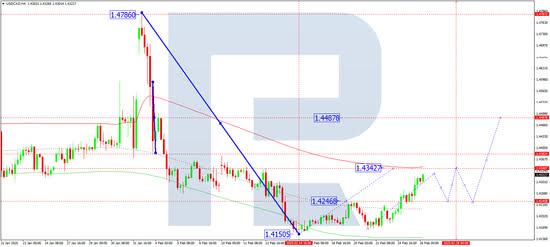
USDCAD forecast
On the H4 chart, USDCAD is extending its growth wave towards 1.4343. Today, 26 February 2025, the market is expected to reach this level, followed by a correction to 1.4245 before another potential rise towards 1.4350.
Technically, this scenario is supported by the Elliott wave structure and the declining wave matrix, with a pivot point at 1.4488. The market is forming a growth wave towards the upper boundary of the price Envelope at 1.4350. After reaching this level, a correction towards the central line at 1.4245 is expected.
Technical indicators suggest further growth towards 1.4343.
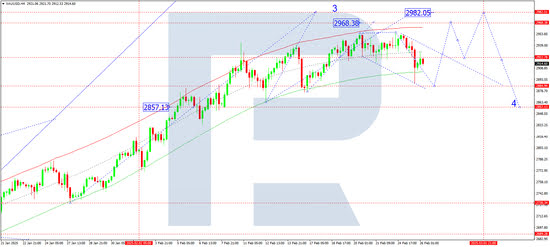
XAUUSD forecast
On the H4 chart, XAUUSD broke below 2,922 and completed a local correction to 2,888. Today, 26 February 2025, the market may rise towards 2,922 for a retest from below before continuing a decline to 2,880. This entire movement is considered a correction to the previous growth wave. After this correction, a new upward wave towards 2,968 is expected.
Technically, this scenario aligns with the Elliott wave structure and the growth wave matrix, with a pivot point at 2,860. The market is consolidating around the central line of the price Envelope. If the price breaks upwards, a move towards 2,968 is likely, followed by a correction towards the Envelope’s lower boundary at 2,880. If it breaks downwards, a correction towards 2,880 could develop.
Technical indicators suggest a continued correction towards 2,880.
Brent forecast
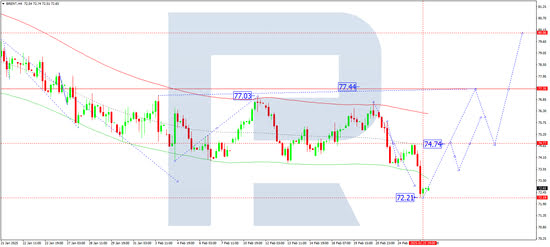
On the H4 chart, Brent completed a decline towards 72.22. Today, 26 February 2025, a rise towards 74.74 is expected. If this level is broken, the price may continue towards 77.40, which is the first target.
Technically, this scenario aligns with the Elliott wave structure and the declining wave matrix, with a pivot point at 77.40. The market has reached the lower boundary of the price Envelope at 72.22, and an upward move towards the upper boundary at 77.40 is likely.
Technical indicators suggest a potential upward wave towards 74.74.