The US Tech index closed Tuesday’s trading session with a 0.35% decline. Ahead of the FOMC minutes release, the index may continue to correct before resuming its upward trend.
US Tech forecast: key trading points
- The FOMC minutes release
- US initial jobless claims: previously at 227,000, projected at 233,000
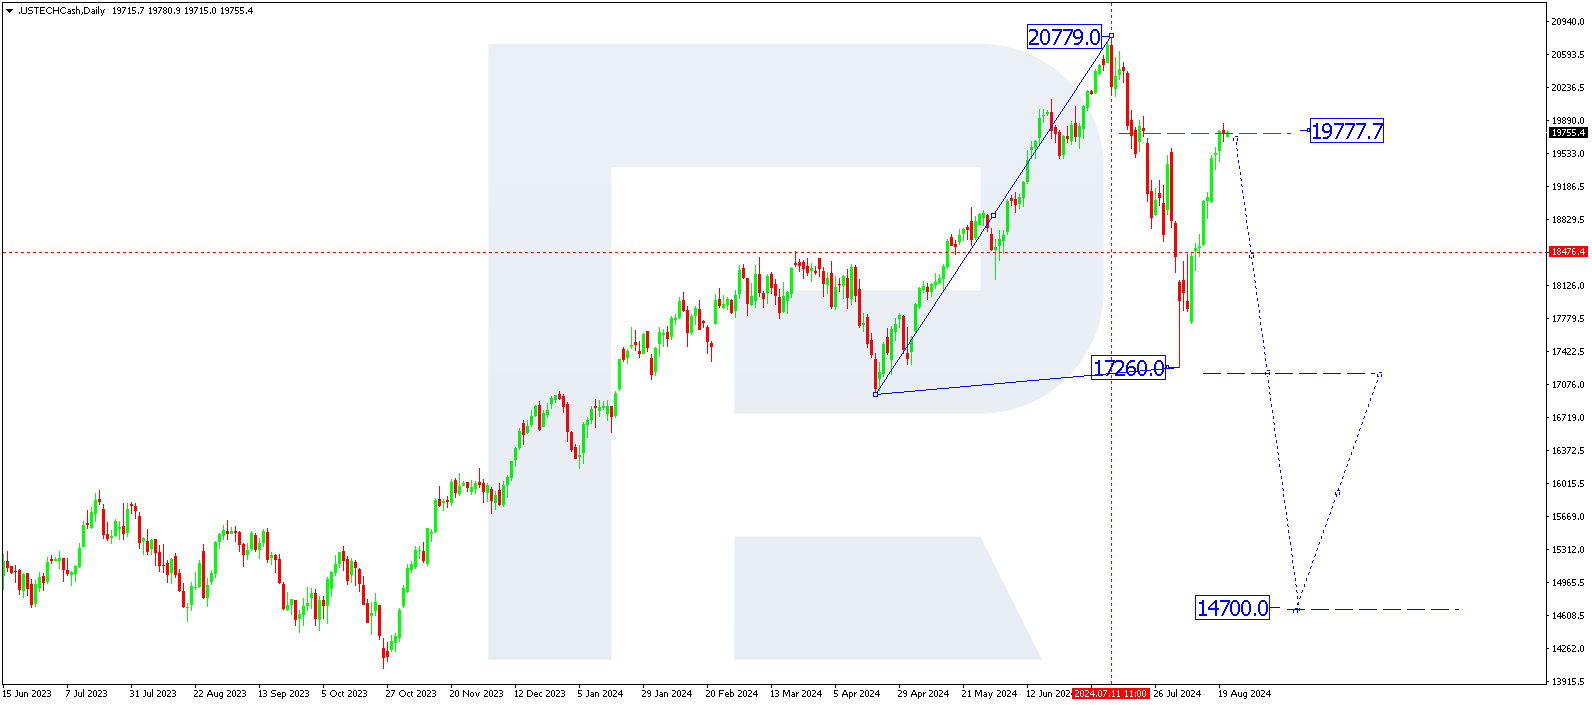
- Resistance: 19,777.7, Support: 17,260.0
- US Tech price forecast: 18,476.0 and 20,140.0
Fundamental analysis
Investors are awaiting the release of the FOMC minutes. The forecast for US initial jobless claims is concerning, with an expected increase to 233,000 from the previous reading of 227,000. Consequently, the US Tech index closed yesterday’s trading session with a 0.35% decline.

.png)
Source: https://tradingeconomics.com
The US Tech analysis shows that the index closed the trading session on 20 August 2024 dipping 0.35%. Although the index represents the technology segment, a decline in the commodities and financial sectors could have negatively impacted the price. Markets are awaiting the FOMC meeting results and preliminary US interest rate changes data.
An increase in initial jobless claims could negatively impact the technology sector and weigh on the US Tech index. If the data is below the forecast, there are all the conditions for growing investor confidence in tech stocks and, hence, a further rise in the US Tech price.
The US Tech forecast for next week remains unchanged, with the price likely to continue its uptrend after a correction, potentially reaching new all-time highs.
US Tech technical analysis
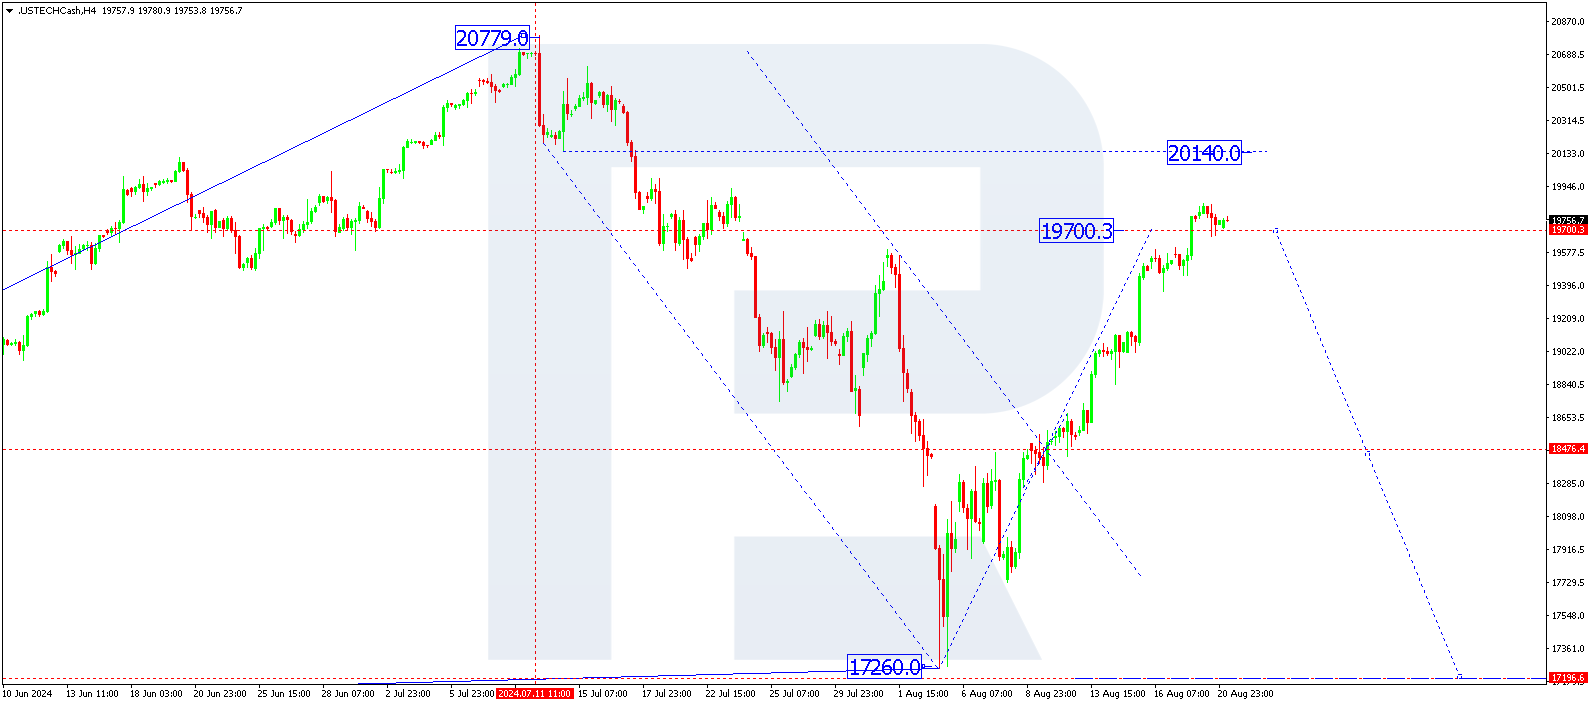
The US Tech H4 chart shows that the market has completed a corrective wave, reaching 19,850.0. A consolidation range is expected to form around this level today, 21 August 2024. With an upward breakout, the wave could extend to 20,140.0. A downward breakout will open the potential for a decline to 18,476.0, with the trend potentially continuing to the local target of 17,200.0.

.png)
Key US Tech levels to watch in today’s forecast include:
- Resistance level: 19,777.7 – with an upward breakout, the price could reach 20,140.0
- Support level: 17,260.0 – a breakout below this level will signal that the trend continues to 14,700.0
Summary
The US Tech index has every chance to continue a correction in the subsequent few trading sessions. Fundamental data in the US Tech price forecast for next week and technical indicators suggest that the growth structure is a correction of the first previous downward wave. Once the correction is complete, a new downward wave could begin, aiming for the 18,476.0, 17,200.0, and 14,700.0 levels.
