EURUSD, “Euro vs US Dollar”
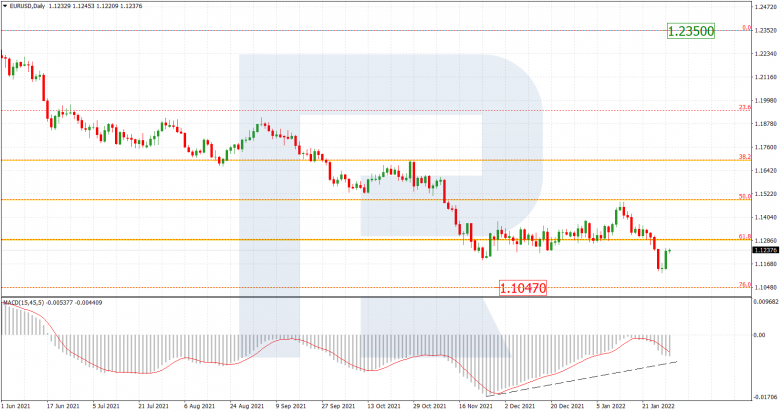
As we can see in the daily chart, the downtrend continues as the asset is heading towards 76.0% fibo at 1.1047. At the moment, the pair is correcting upwards after completing the previous descending impulse. After the pullback is over, EURUSD may resume falling towards its key target. At the same time, there is divergence on MACD, which may indicate a possible tendency reversal.


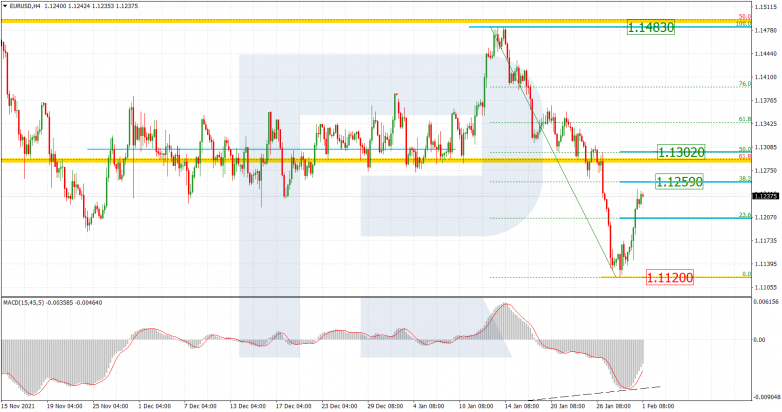
The H4 chart shows a more detailed structure of the current correction, which has already broken 23.6% fibo and may later continue towards 38.2% and 50.0% fibo at 1.1259 and 1.1302 respectively. The key resistance is at 1.1483, while the support is the local low at 1.1120.


USDJPY, “US Dollar vs. Japanese Yen”
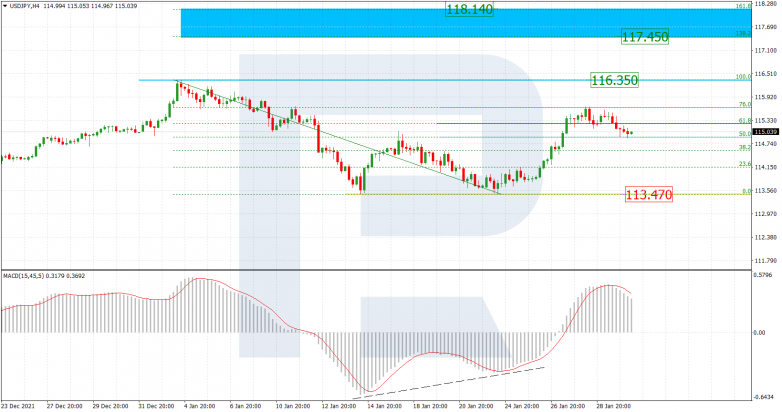
As we can see in the H4 chart, USDJPY is moving upwards after convergence on MACD; it has already reached 76.0% fibo and may later continue to break the high at 116.35. After that, the instrument may continue growing towards the post-correctional extension area between 138.2% and 161.8% fibo at 117.45 and 118.14 respectively. The key support is the low at 113.47.


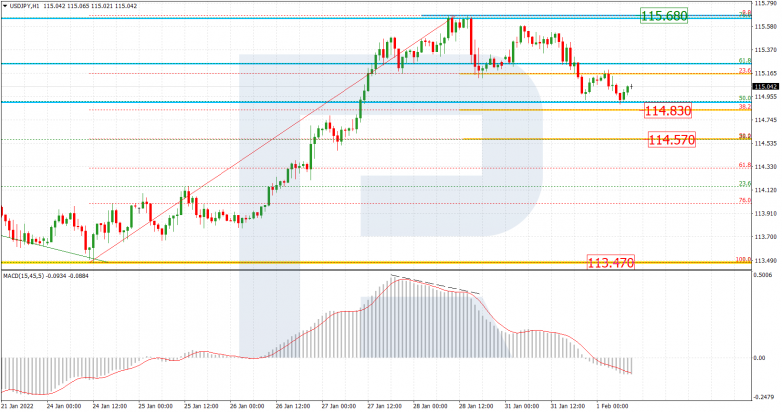
In the H1 chart, local convergence made the pair stop growing and start a new correctional downtrend, which has already broken 23.6% and may later continue towards 38.2% and 50.0% fibo at 114.83 and 114.57 respectively. A breakout of the local resistance at 115.68 will result in a further mid-term uptrend.


