EURUSD, “Euro vs US Dollar”
As we can see in the daily chart, EURUSD is forming the fifth structure of the descending wave with the target at 1.1170 (at least). By now, the pair has already tested 1.1380. Possibly, the pair may rebound from this level and resume falling to reach the above-mentioned target. The structure of this descending wave implies that it may reach 1.1110. After that, the instrument may start a new pullback towards 1.1717; the first correctional target will be at 1.1380.


GBPUSD, “Great Britain Pound vs US Dollar”
In the daily chart, GBPUSD has completed the third descending wave at 1.3194. However, the last structure of the wave implies that it may be extended down to 1.3130. After reaching the latter level, the instrument may start another pullback towards 1.3600; the first correctional target at 1.3370.


USDRUB, “US Dollar vs Russian Ruble”
As we can see in the daily chart, after completing the ascending correction at 75.80, USDRUB is expected to break the correctional channel and resume trading within the downtrend to reach. The first downside target is at 71.85.


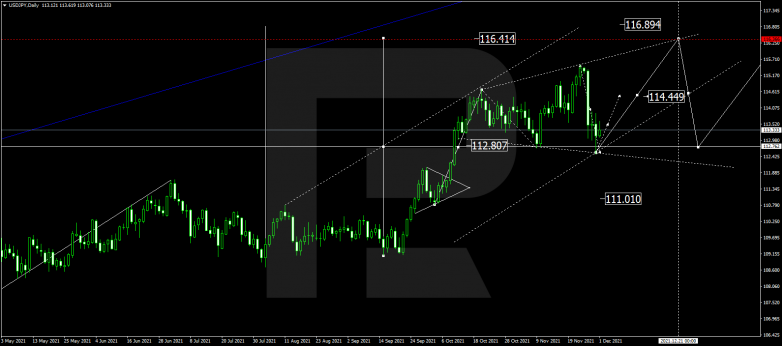
USDJPY, “US Dollar vs Japanese Yen”
In the daily chart, USDJPY has finished the correction at 112.80. Possibly, the pair may start a new growth towards 116.40. The first upside target is at 114.44.


BRENT
As we can see in the daily chart, Brent has completed the correction at 67.70; right now, it is forming a new wave to the upside to reach 77.00. Later, the market may start another correction towards 72.20 and then resume trading upwards with the short-term target at 82.50.


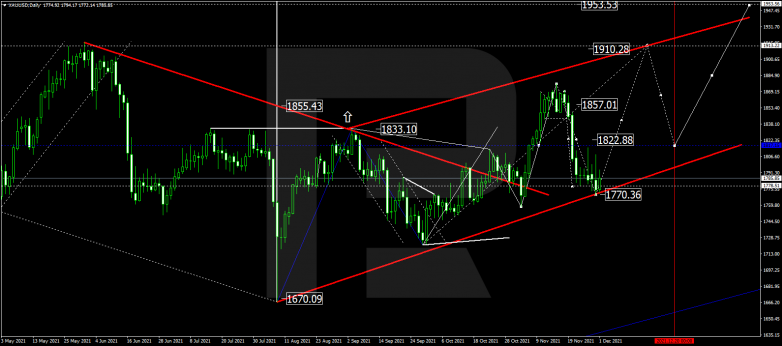
XAUUSD, “Gold vs US Dollar”
In the daily chart, after finishing the correctional wave at 1770.00, Gold is expected to grow towards 1910.00. The first upside target is at 1842.20.


S&P 500
In the daily chart, the S&P index has completed the correction at 4562.0. Later, the market may start a new ascending wave towards 4770.0. The first upside target is at 4666.6.


