EURUSD, “Euro vs US Dollar”
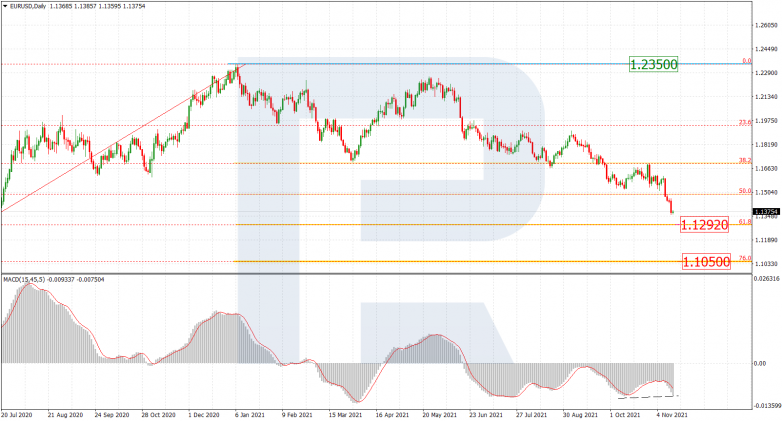
The daily chart of EURUSD shows that the “bearish” phase is escalating. After testing and breaking 50.0% fibo, the asset is heading towards 61.8% fibo at 1.1292, a breakout of which may lead to a further downtrend to reach 76.0% fibo at 1.1050. At the same time, local convergence on MACD indicates a possible pullback or even a reversal.


The H1 chart shows convergence on MACD, which may hint at a possible pullback after the pair reaches 61.8% fibo at 1.1292. If it happens, the asset may grow and reach 23.6%, 38.2%, and 50.0% fibo at 1.1387, 1.1445, and 1.1491 respectively. A breakout of the fractal high at 1.1692 will result in a further uptrend towards the long-term high.


USDJPY, “US Dollar vs. Japanese Yen”
As we can see in the H4 chart, after failing to reach 38.2% fibo at 112.56 after divergence on MACD, USDJPY has formed a new rising wave heading towards the high at 114.70, a breakout of which may result in a further uptrend to reach the post-correctional extension area between 138.2% and 161.8% fibo at 115.45 and 115.92 respectively. However, the pair may rebound from the high and resume falling towards 38.2% and 50.0% fibo at 112.56 and 111.91 respectively. The key support is the low at 109.11.


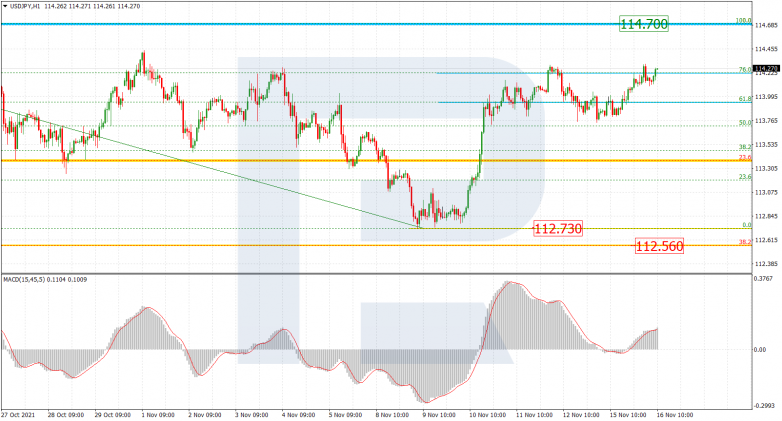
The H1 chart shows the second test of 76.0% fibo before another attempt to reach the high at 114.70. The local support is at 112.73.


