Rates as of 05:00 GMT

Market Recap
Rising inflation and expectations of more hawkish central bank response were the two themes moving the market yesterday.
First, the US consumer price index (CPI) for June was terrible! At 9.1% year-on-year it was higher than any of the 50 or so economists polled by Bloomberg thought possible (forecast range: 8.1%-8.9%, median 8.8%). The month-on-month rise of 1.3% was higher than the year-on-year rise less than two years ago (November 2020: 1.2% yoy). Pretty bad! And while the core rate of inflation slowed slightly on a year-on-year basis it accelerated on a month-on-month basis, indicating that the main issue isn’t just higher oil prices – inflation is spreading to other goods as well. Services are contributing more and more to the rise in inflation. That’s probably due to the tight labor market, which the Fed is going to be aiming at.
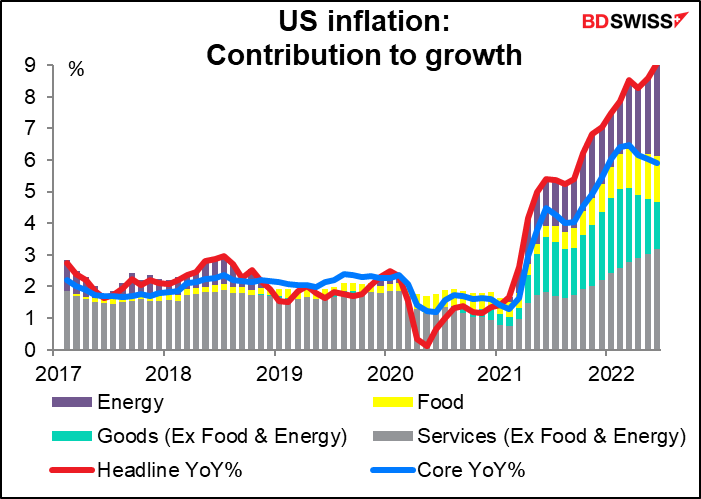
Before the figure came out, the market thought a 75 bps rate hike was a near-certainty at this month’s meeting of the rate-setting Federal Open Market Committee. The market quickly flipped to forecasting a 100 bps hike for the July 27th meeting.
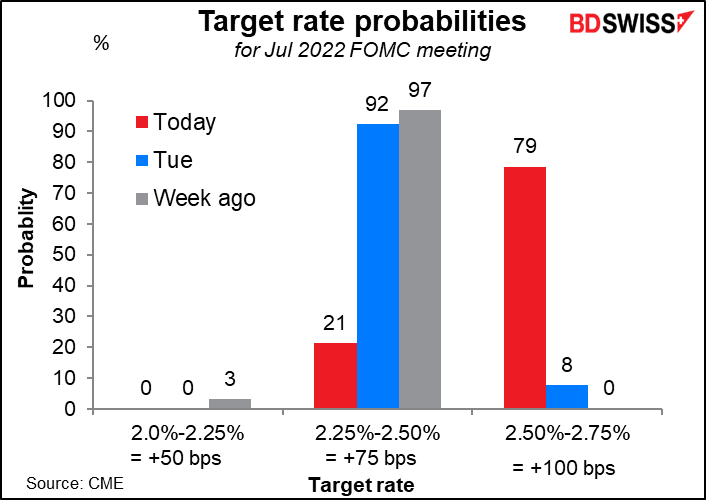
And a 75 bps hike in September on top of the 100 bps hike! If you notice the blue bars, before the CPI came out the market was forecasting a 75 bps hike in July followed by a 25 bps hike in September. So it’s now assuming 25 bps more in July and 50 bps more in September = 75 bps more near-term tightening than before the CPI came out.

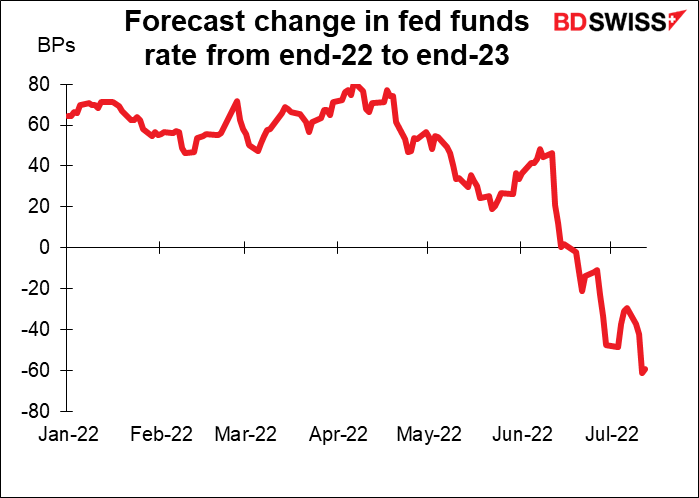
But that wasn’t the big news, in my view. The more important change was the increase in the amount of loosening expected in 2023. At the end of the day, the market had increased its expectations of end-2022 rates by 26 bps but its estimate of end-2023 rates by only 6 bps, meaning that the market now expects the Fed to cut rates by 61 bps in 2023 vs 42 bps before the CPI came out. This is probably why the US stock market didn’t fall that much – the more the Fed tightens now, the earlier the recession comes and the sooner they loosen again.
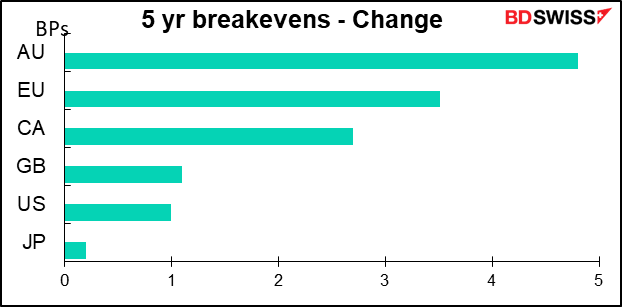
With inflation in the US jumping so much, inflation expectations rose around the world.
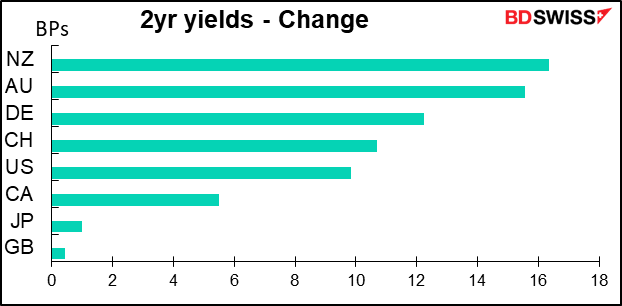
And so did expectations of tightening by other central banks as well, as shown by the rise in two-year yields, which are sensitive to expected policy changes (since a two-year interest rate can be conceived of as an overnight interest rate rolled over every day for 730 days).
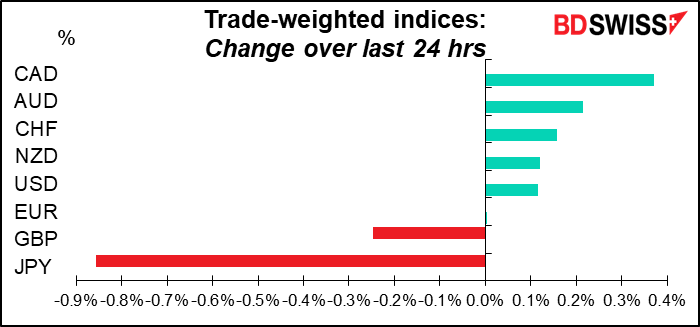
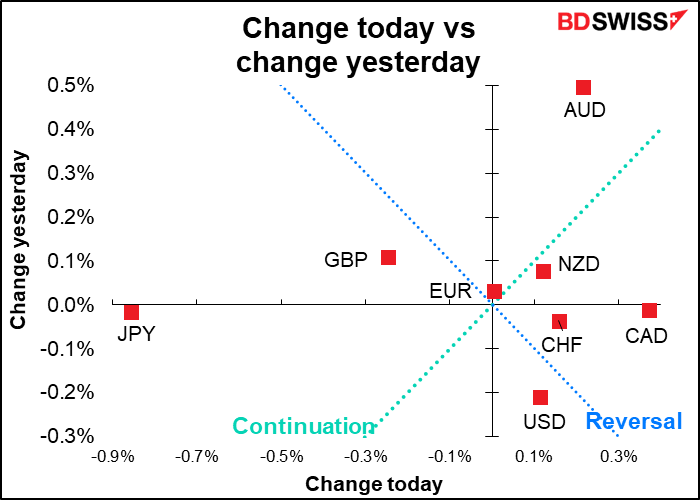
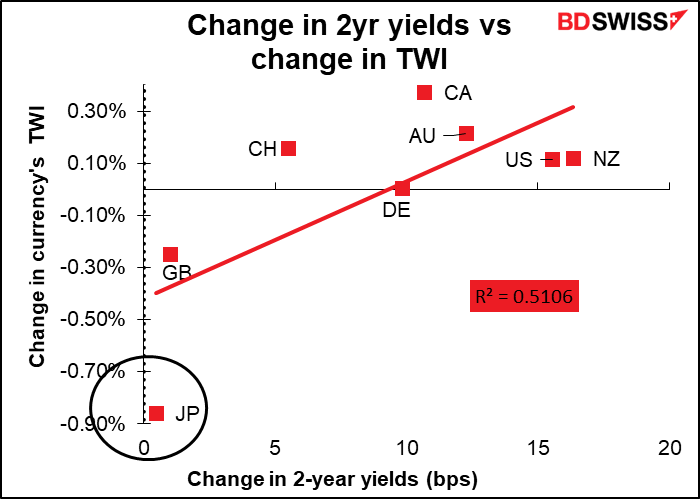
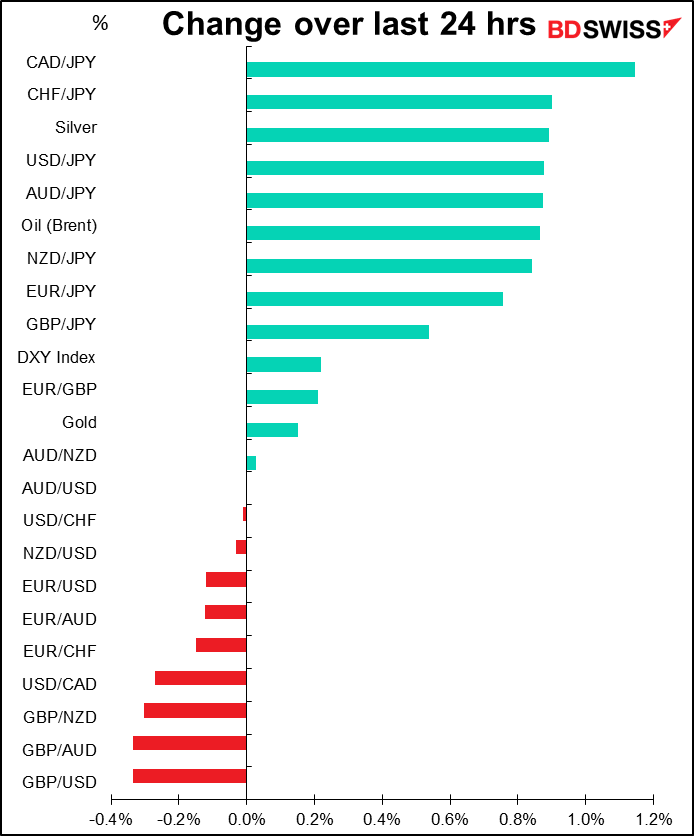
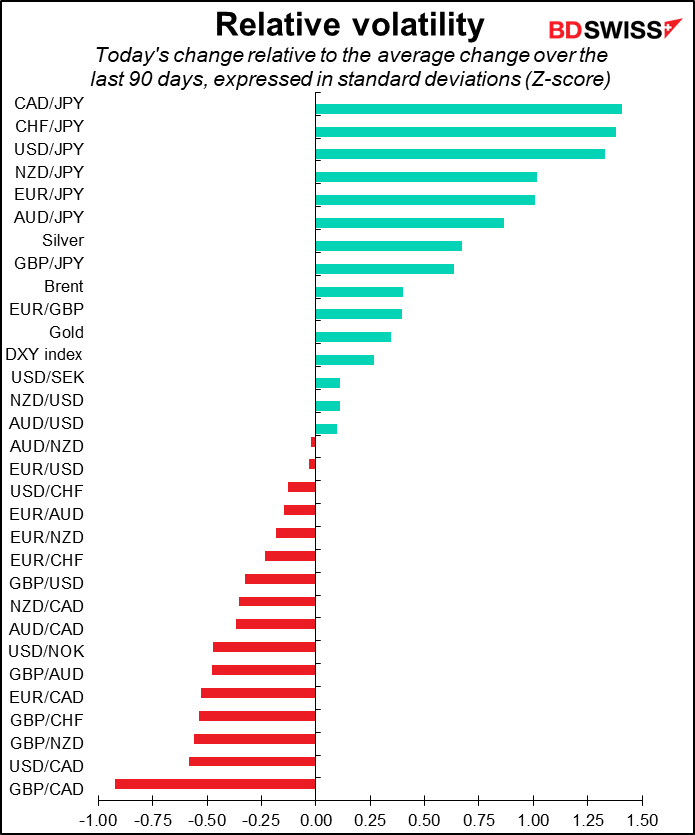
The movement in 2-year yields explains about half the movement in currencies yesterday. JPY was the outlier because of course Japan’s 2-year yields aren’t going to move at all, since no one expects the Bank of Japan to change its policy rate over the next two years.
Shortly after the shock of the higher-than-expected CPI, the Bank of Canada gave the market another shock with a 100 bps rate hike. Most forecasters had expected a 75 bps hike, only one of the 30 economists polled by Bloomberg had forecast that result (vs the several who had forecast only a 50 bps hike).
The Bank did soften its forward guidance a bit; the Governing Council now says it “is resolute in its commitment to price stability and will continue to take action as required to achieve the 2% inflation target” instead of being “prepared to act more forcefully if needed to meet its commitment to achieve the 2% inflation target.” So they dropped the bit about being “prepared to act more forcefully,” which is good because I don’t think anyone is expecting a 125 bps hike!
Rate expectations for year-end in Canada rose by 23 bps and CAD was the best-performing currency.
The Bank of Canada rate hike follows the Reserve Bank of New Zealand’s 50 bps hike with a pledge of “briskly lifting the OCR until it is confident that monetary conditions are sufficient to constrain inflation expectations and bring consumer price inflation to within the target range.” So the overall impression is that inflation is becoming more intractable and central banks are becoming more resolute in fighting it. As a result, we can expect that “monetary policy divergence” – the different expectations for how central banks will act – may continue to be the main driving factor in FX markets, to the advantage of USD and the detriment of JPY and EUR.
Today’s market
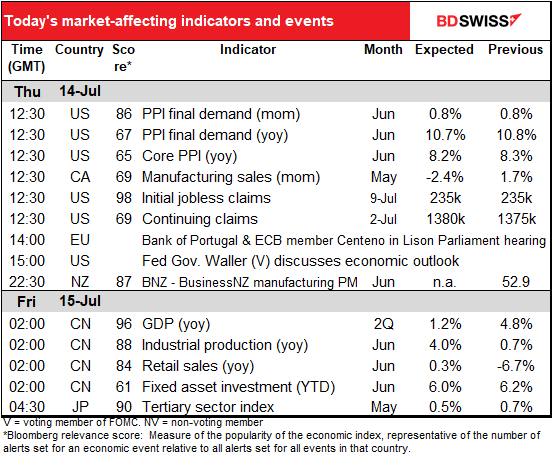
Note: The table above is updated before publication with the latest consensus forecasts. However, the text & charts are prepared ahead of time. Therefore there can be discrepancies between the forecasts given in the table above and in the text & charts.
After yesterday’s blowout US consumer price index (CPI) comes today’s US producer price index (PPI). The relationship between the two isn’t simple – one might think that higher producer prices eventually lead to higher consumer prices, but sometimes the causality goes the other way too. And the lag between them isn’t well defined, either. But we can say for certain that rising producer prices aren’t going to drag down consumer prices!
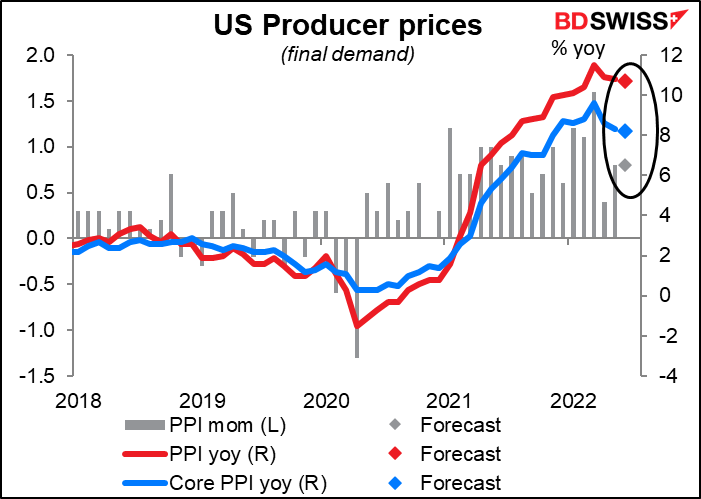
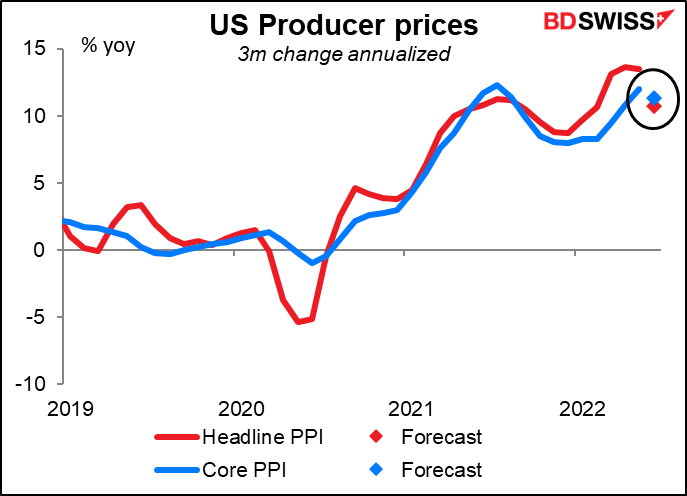
The PPI is slowing. Not only the year-on-year change, but also if we take the three-month change and annualize it, that too is expected to slow. That could be taken as a good sign for now – that upstream pressures are diminishing – but I wonder if it’ll be enough to change anyone’s narrative.
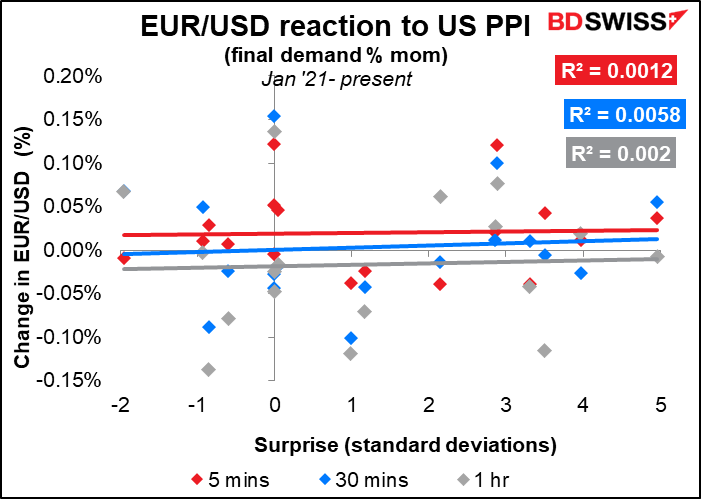
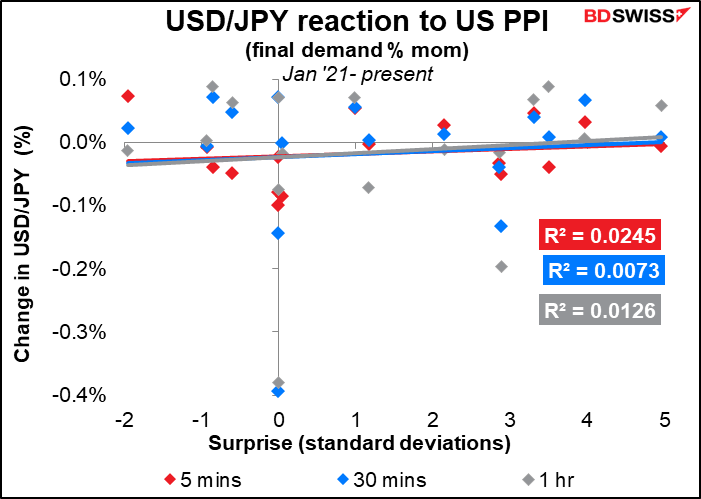
This indicator, although important, doesn’t have that much of a direct impact on currencies as far as I can tell. Or at least it didn’t. I’d expect that now that inflation is the main focus of financial markets it may have more of an impact than usual. (Note: I tried these graphs with all four measures of the PPI, headline and core, month-on-month and year-on-year change; none had any better relationship than the others.)
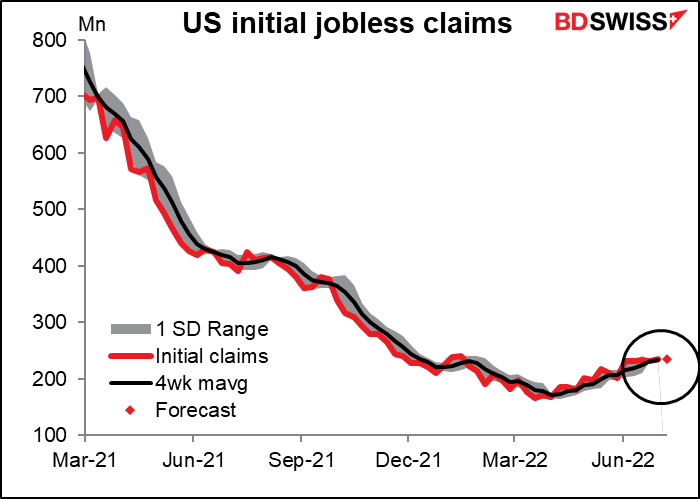
US initial jobless claims are getting quite boring; in 11 out of the last 15 weeks, the change has been less than ±10k. The average change has been 5k, the median -1k. This week the market is forecasting no change, which is as good a forecast as any at this point, I’d say. Plus in light of the extremely strong June nonfarm payrolls report just last Friday, today’s jobless claims will probably not create many waves.
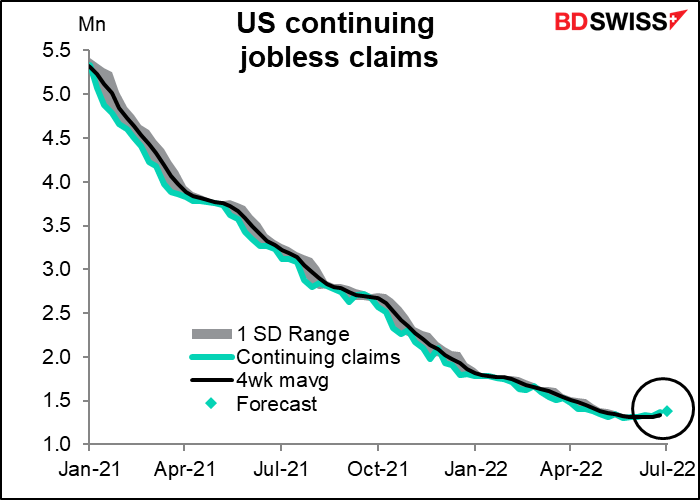
Both initial and continuing claims have climbed a bit from their lows, but seeing as the lows were almost historical lows for these data series (which aren’t adjusted for the size of the US population), that’s still incredibly good. Added to the excellent NFP, it’s another sign of the strong US labor market – strong enough to withstand Fed tightening. USD
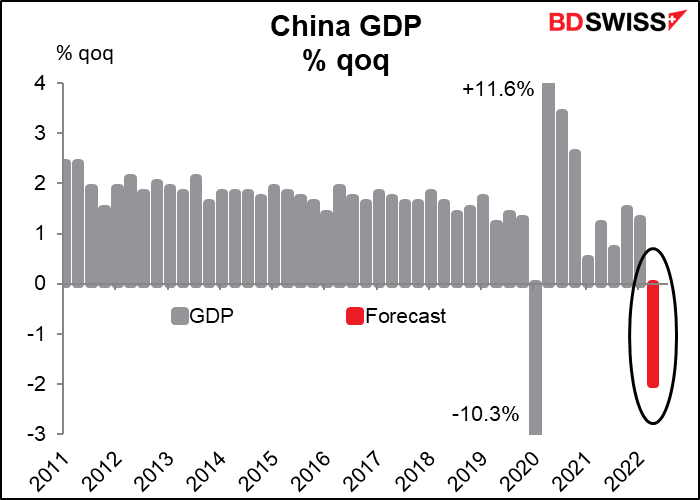
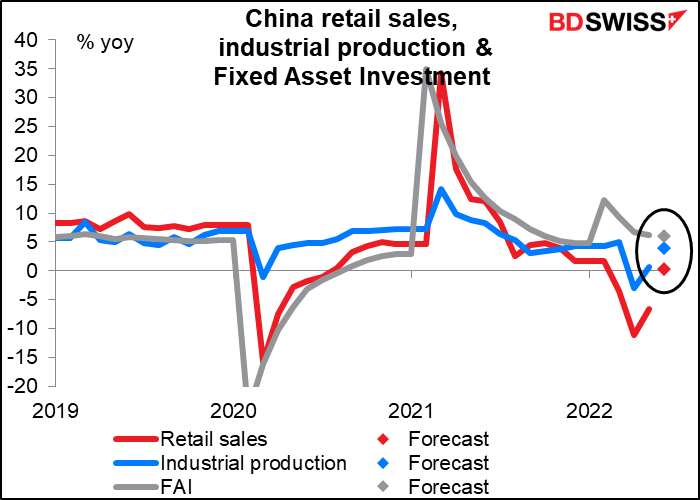
Overnight we get the usual trifecta of Chinese indicators – industrial production, retail sales, and fixed asset investment (FAI). This month brings the major Chinese indicator: the quarterly GDP figure. The market is expecting GDP growth of only 1.2% yoy, which would be the slowest growth in China since at least 1980 except for the three pandemic quarters (Q1, Q2, and Q3 of 2020). That’s pretty bad and could weigh on the commodity currencies, particularly AUD.

You can see how unusual a fall in output is. We only have quarterly GDP data back to 2011 so we don’t know exactly what happened during the 2008 Global Financial Crisis, but it seems that this last quarter was unusually bad.
Meanwhile though things are looking up! Growth in retail sales and industrial production are both predicted to have accelerated in June, with retail sales finally surpassing last year’s level. It remains to be seen whether the market is in a “cup half empty” mood, emphasizing the fall in GDP, or a “cup-half-full” mood, emphasizing the recovery in June. Given the recent breakout of the virus again and fears that Shanghai may go back into some kind of lockdown, I would guess the “glass-half-empty” brigade will win the day and the fall in GDP will be the dominant figure.
Japan’s tertiary sector index is forecast to rise a bit less than in the previous month. But that would still be higher than the six-month moving average, which shows almost no increase at all ( 0.1% mom). The three consecutive months of increase (assuming this month’s forecast is correct) suggest that Japan’s service sector may finally be getting out from under the virus restrictions. In theory this would be positive for JPY however at this point I don’t think anyone really cares that much.

Source: BDSwiss