Previous Trading Day’s Events (30.07.2024)
- German Prelim CPI m/m:
Germany’s inflation rate came in at 2.3% YoY, following a provisional CPI increase of 0.3% MoM. The Harmonised Index of Consumer Prices (HICP) showed a 2.6% YoY and 0.5% MoM rise, while core inflation, excluding food and energy, was recorded at 2.9%.
- CB Consumer Confidence:
Consumer confidence rose to 100.3 in July from a revised 97.8 in June. However, the Present Situation Index fell to 133.6 from 135.3, while the Expectations Index increased to 78.2 from 72.8, still below the 80 mark that often signals recession risks.
- JOLTS Job Openings:
Job openings held steady at 8.184 million, slightly below the revised May figure of 8.23 million and surpassing the 8 million forecast. Openings increased in accommodation and food services ( 120K) and state and local government (excluding education) ( 94K), while they declined in durable goods manufacturing (-88K) and federal government (-62K).
______________________________________________________________________
Winners Vs Losers
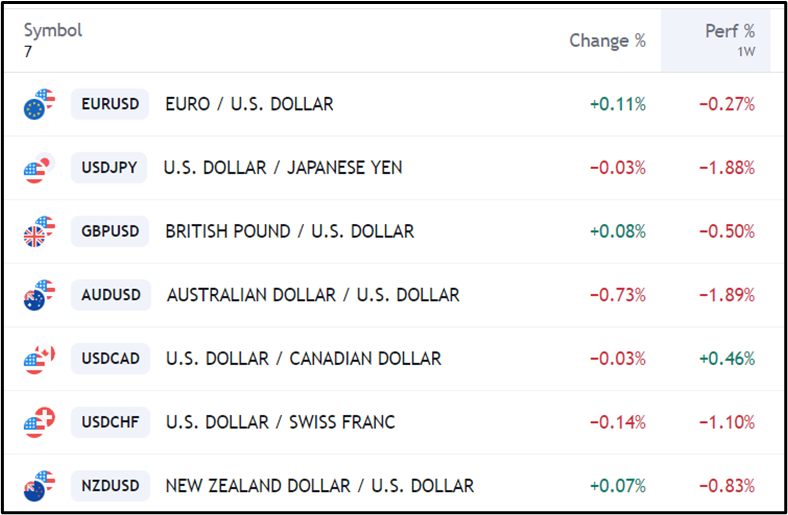
USD/CAD is leading this week with a 0.46% gain. AUD/USD and USD/JPY are the largest decliners, down 1.89% and 1.88%, respectively. EUR/USD and GBP/USD have seen modest increases of 0.11% and 0.08%. NZD/USD and USD/CHF have fallen by 0.83% and 1.10%.
Today, EUR/USD, GBP/USD, and NZD/USD are marginally up, while USD/JPY, AUD/USD, and USD/CHF are down.
 ______________________________________________________________________
News Reports Monitor – Previous Trading Day (30.07.2024)
Server Time / Timezone EEST (UTC 03:00)
- Midnight – Night Session (Asian)
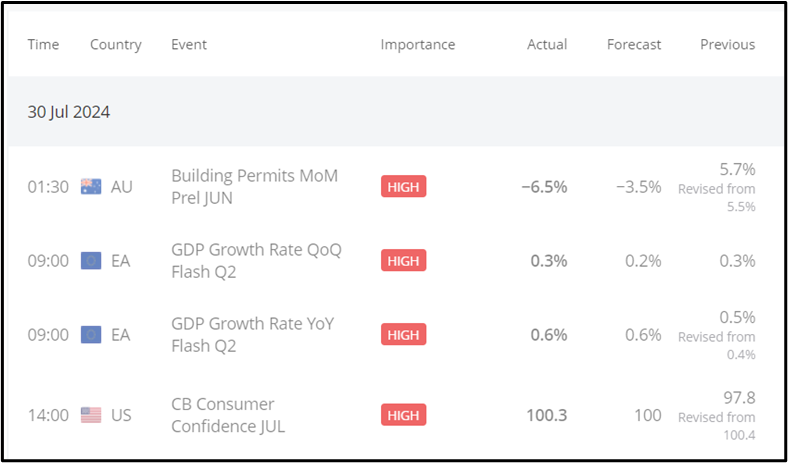
Building Permits MoM for June showed a decline of 6.5%, falling short of the anticipated -3.5% and down from the previously revised figure of 5.7%.
- Morning – Day Session (European and N. American Session)
The Eurozone Q2 GDP Growth Rate met expectations with a 0.3% QoQ increase and was revised up to 0.6% YoY from 0.4%. Meanwhile, in New York, July’s CB Consumer Confidence came in at 100.3, slightly above the forecast but just below the revised previous value of 100.4.
General Verdict:
- Gold bounced back to $2,420/oz, recovering from earlier losses amid safe-haven demand due to Middle East tensions.
- WTI crude futures rose to near $76/bbl, reversing a prior 1% decline as Middle East risks impacted oil supply.
- The Euro stayed around $1.082, below the four-month high of $1.094, with economic data not altering ECB rate cut expectations.
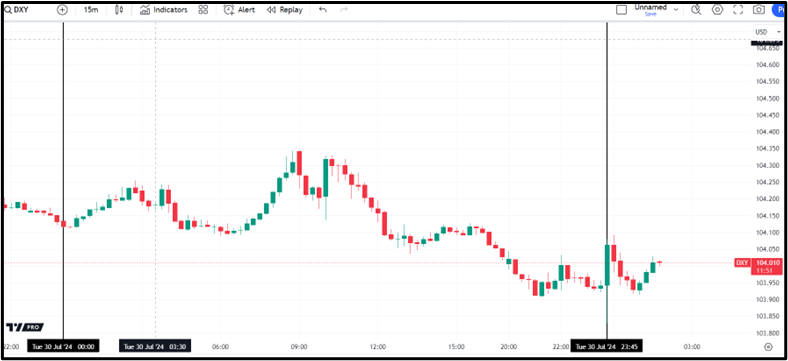
- The dollar index remained steady near 104.4, with traders awaiting the Federal Reserve’s policy decision.
 __________________________________________________________________
FOREX MARKETS MONITOR
EURUSD (30.07.2024) 15m Chart Summary
Server Time / Timezone EEST (UTC 03:00)
Price Movement
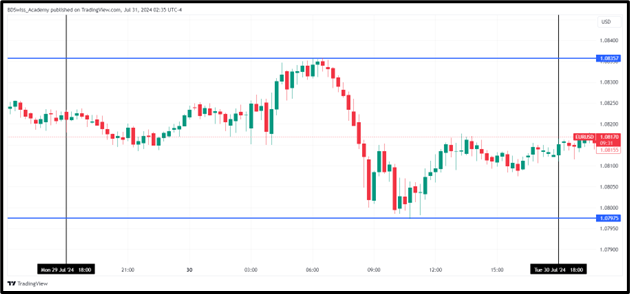
The EUR/USD 15-minute chart indicated a range-bound market with resistance at 1.08364 and support at 1.07975. The session began at 1.08242, dipped to 1.08134, then rallied past the opening price to reach the daily high of 1.08364 before falling through initial support to hit the day’s low of 1.07975.
 ___________________________________________________________________
CRYPTO MARKETS MONITOR
BTCUSD (Bitcoin) Chart Summary 1H
Server Time / Timezone EEST (UTC 03:00)
Price Movement
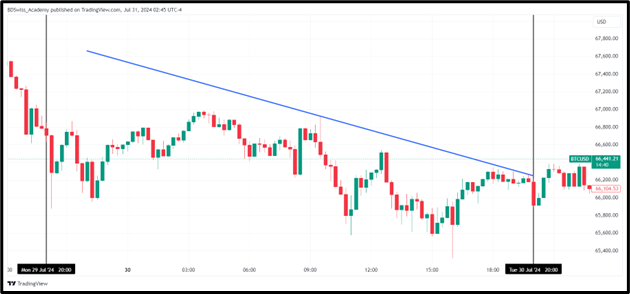
On a 15-minute chart, BTCUSD showed a downtrend, opening at $66,707.17 and closing at $66,412.49. It initially fell to $65,868.81, spiked to a daily high of $66,975.25, then dropped to a low of $65,327.78 before closing at $66,412.49.
 ______________________________________________________________________
EQUITY MARKETS MONITOR
S&P500 (SPX500) 4-Day Chart Summary
Server Time / Timezone EEST (UTC 03:00)
Price Movement
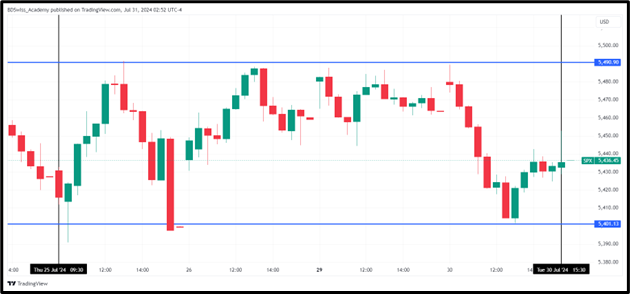
On the 30-minute S&P 500 chart, the market has shown a range-bound pattern, opening at $5,413.07, rising to $5,490.90, and then falling to $5,401.13.
 ______________________________________________________________________
COMMODITIES MARKETS MONITOR
USOIL (WTI) 4-Day Chart Summary
Server Time / Timezone EEST (UTC 03:00)
Price Movement
The 1-hour chart of USOIL indicates a downtrend over the past four days, with the price opening at $76.96, declining to $76.04, then rising to a peak of $78.55 before falling to $74.53, and closing at $75.96.
 XAUUSD (Gold) 4-Day Chart Summary
Server Time / Timezone EEST (UTC 03:00)
Price Movement
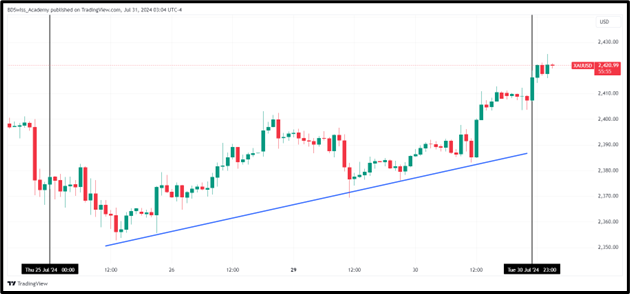
The 1-hour chart for XAUUSD reveals a recent uptrend over the past four days, starting from an opening price of $2,374.95, dipping to a low of $2,352.63, and subsequently rallying to a high of $2,416.57 by the close.
 ______________________________________________________________
News Reports Monitor – Today Trading Day (31.07.2024)
Server Time / Timezone EEST (UTC 03:00)
- Midnight – Night Session (Asian)
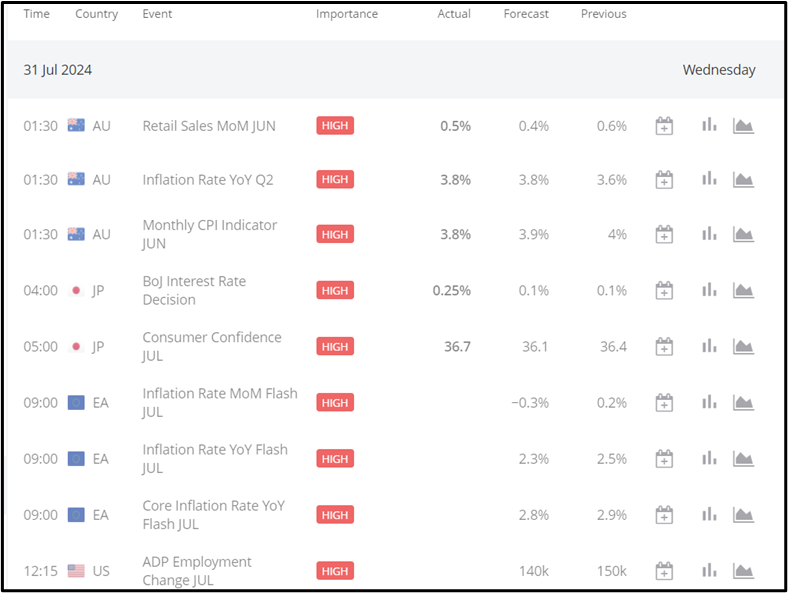
Australian CPI for QoQ came in at 1.0% and YoY at 3.8%, both below forecast expectations. Meanwhile, China’s PMI registered at 49.4, and the BOJ’s rate remains at 0.25%.
- Morning – Day Session (European and N. American Session)
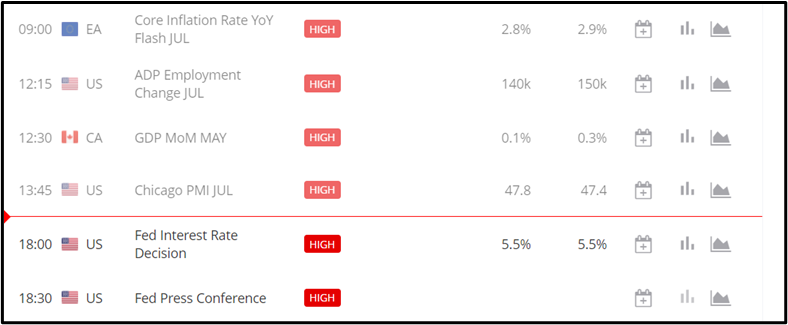
Eurozone Core CPI YoY is forecasted at 2.8%. In New York, the ADP Non-Farm Employment forecast is 140K, while Canada’s GDP MoM is projected at 0.1%. The Fed Funds Rate is expected to be 5.50%, with the FOMC statement and press conference upcoming.
______________________________________________________________
Source:
https://www.bls.gov/
https://www.conference-board.org/topics/consumer-confidence
https://www.destatis.de/EN/Press/2024/07/PE24_290_611.html
https://www.tradingview.com/markets/currencies/rates-major/
https://km.bdswiss.com/economic-calendar/
https://www.tradingview.com/chart/EMXIYOD6/?symbol=CAPITALCOM:DXY
Source: BDSwiss