PREVIOUS TRADING DAY EVENTS – 29 Sep 2023
- According to the Gross Domestic Product (GDP) report for Canada, GDP remained unchanged in July as the manufacturing sector posted its biggest decline in more than two years, but it most likely ticked up 0.1% in August according to Statistics Canada.
The economy has been slowing down after 10 interest rate hikes since early last year.
“The economic data … continue to paint a picture of an economy that has stalled,” Royce Mendes, head of macro strategy of Desjardins Group said in a note. “(That) should give central bankers confidence that their medicine is slowly working.”
“Canada is really struggling to grow right now … (this) argues for (the bank) to remain on hold and lean on the tightening that has already been put in place,” said Robert Kavcic, senior economist at BMO Economics.
The manufacturing sector shrank by 1.5% over June, the biggest month-on-month drop since April 2021, largely due to firms drawing down their inventories.
Source:
https://www.reuters.com/markets/canada-economy-stalled-july-most-likely-grew-by-01-aug-2023-09-29/
- Consumer spending increased by 0.4% and the Core Personal Consumption Expenditures (PCE) Price index was reported lower than expected change. It is signalling that the underlying U.S. inflation moderated in August.
“This report suggests that there’s progress on inflation,” said Conrad DeQuadros, senior economic advisor at Brean Capital in New York. “I think Fed officials are at the point where they’re shifting the focus to how long do we keep rates at these high levels, rather than how much higher the rates have to go.”
The PCE price index, excluding the volatile food and energy components, edged up 0.1% last month. That was the smallest rise since November 2020 and followed a 0.2% advance in July.
The University of Michigan showed that consumers’ 12-month inflation expectations fell to 3.2% for the month, the lowest since March 2021, from 3.5% in August. Consumers’ long-run inflation expectations slipped to 2.8% from 3.0% last month.
“Getting (the) year-over-year (core) number below 4% could be a big psychological victory for the bulls and help keep a lid on the 10-year yield,” said David Russell, global head of market strategy at TradeStation.
Consumer spending, which accounts for more than two-thirds of U.S. economic activity, rose 0.4% last month after surging 0.9% in July. It is actually cooling.
US Congress avoided a government shutdown, which would place thousands of federal employees on furlough without pay and suspend various government services, as they came to a last-minute deal as per the reports today from various sources.
Source: https://www.reuters.com/markets/us/us-consumer-spending-rises-august-underlying-inflation-slows-2023-09-29/
https://www.bbc.com/news/world-us-canada-66973976
______________________________________________________________________
News Reports Monitor – Previous Trading Day (29 Sep 2023)
Server Time / Timezone EEST (UTC 03:00)
- Midnight – Night Session (Asian)
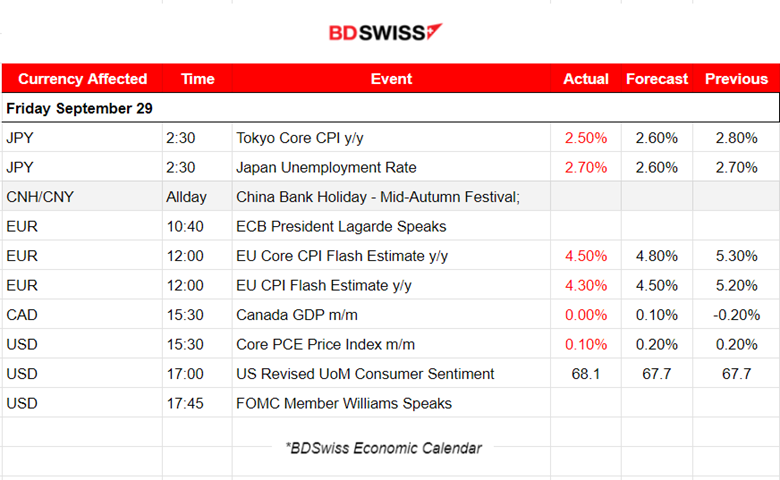
Tokyo’s annual Core CPI change was reported to be 2.5% lower than expected. It seems to have slowed for the third straight month due to falling fuel costs. Japan’s unemployment rate was reported at 2.70% which shows that actually remains unchanged since the previous report. There was no shock recorded in the market when these figures were released. However, we currently observe that volatility is increasing for JPY pairs.
- Morning–Day Session (European and N. American Session)
The yearly changes in CPI Flash estimates were reported lower than expected. The EUR seemed to lose strength after the announcements while the USD depreciated. However, no major shock was observed but rather steady movements in one direction.
At 15:30 the monthly GDP change for Canada was reported 0%. Services-producing industries edged up 0.1% in the month, while goods-producing industries contracted 0.3%. After the release, the CAD started to depreciate steadily. Once more, the effect on the market was not an intraday shock. The Core PCE figure for the U.S. was reported lower than expected, at 0.1%, confirming the stable price changes, or even the slowdown in inflation. The Fed had paused rate hikes expecting that underlying price metrics should remain downwards despite surging oil prices. The impact on the USD pairs was minimal at that time. However, the USD started to appreciate at a steady pace after that release.
The Revised UoM Consumer Sentiment report took place at 17:00 suggesting that U.S. near-term inflation expectations fell to the lowest level since early 2021 in September while sentiment eased. The sentiment index fell to 68.1 from 69.5 in August. It was reported that consumers expect prices will climb at an annual rate of 3.2% over the next year, down from 3.5% in August. The release had no significant effect on prices.
General Verdict:
- No shocks but rather steady movements for the pairs after the figure was released.
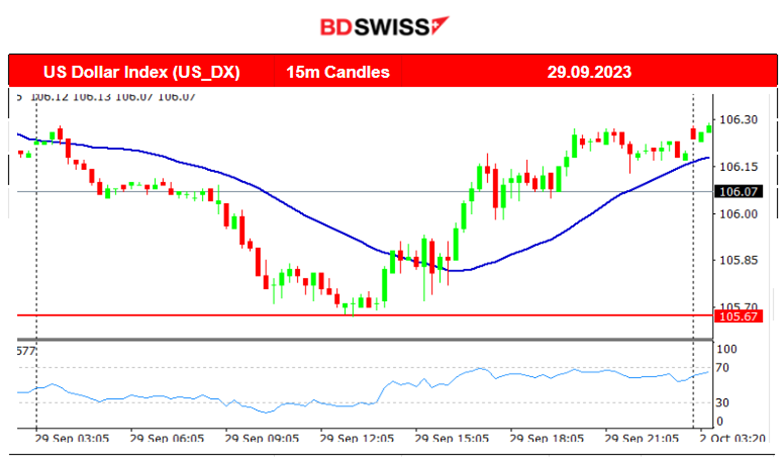
- DXY experiences moderate volatility. It closed near flat overall on Friday.
- U.S. Indices refuse to drop. Their path remains highly volatile while prices seem to have an upward preference.
- Gold and Crude oil dropped further.
____________________________________________________________________
FOREX MARKETS MONITOR
EURUSD (29.09.2023) Chart Summary
Server Time / Timezone EEST (UTC 03:00)
Price Movement
The EURUSD was steadily going upwards early starting from the Asian session mainly as a result of the USD depreciation. It eventually reached a good support level at near 1.06170 and eventually started to drop after the lower-than-expected CPI Flash estimate figures. The pair continued with a downward and volatile movement, partly due to the USD depreciation, until it eventually closed nearly flat for the trading day.

USDCAD (29.09.2023) Chart Summary
Server Time / Timezone EEST (UTC 03:00)
Price Movement
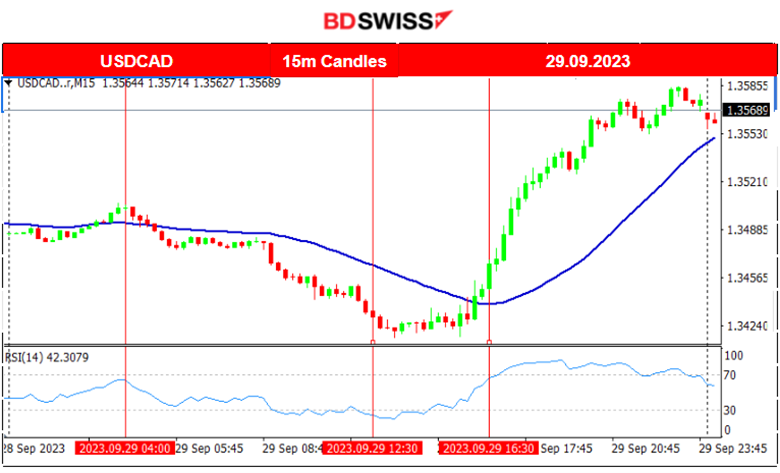
Since the USD started to depreciate early on Friday, the USDCAD was moving to the downside steadily until it found support at near 1.34180. After that, it started to move to the upside and got a push from Canada’s unchanged monthly GDP figure which caused the CAD to depreciate significantly. The pair’s steady upside movement after the release reached more than 138 pips.
___________________________________________________________________
CRYPTO MARKETS MONITOR
BTCUSD (Bitcoin) 4-Day Chart Summary
Server Time / Timezone EEST (UTC 03:00)
Price Movement
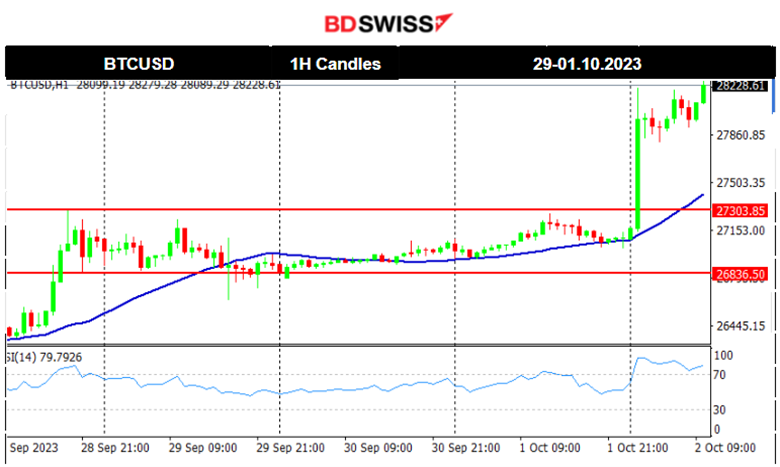
The previous week Bitcoin Jumped near 800 USD finding resistance at 27300 before retracing to the 61.8 Fibo level (around 26850) on the 29th of September. After that, it experienced low volatility during the weekend staying in range. Today a sudden jump is observed at more than 900 USD after breaking the resistance at 27300.
Crypto sorted by Highest Market Cap:
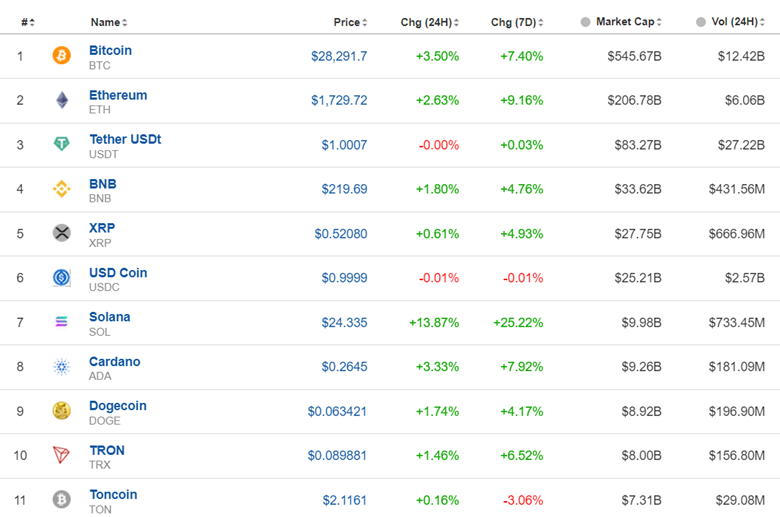
The 7 Days Change is all green. Almost all crypto experienced a surge in price, Solana leads and gained near 25% gains this period. It is clear that these figures are a result of today’s movement. The USD has nothing to do with it since its value against other currencies was not affected significantly. October is actually a month observed to be positive for crypto prices in the past.
Source: https://www.investing.com/crypto/currencies
______________________________________________________________________
EQUITY MARKETS MONITOR
NAS100 (NDX) 4-Day Chart Summary
Server Time / Timezone EEST (UTC 03:00)
Price Movement
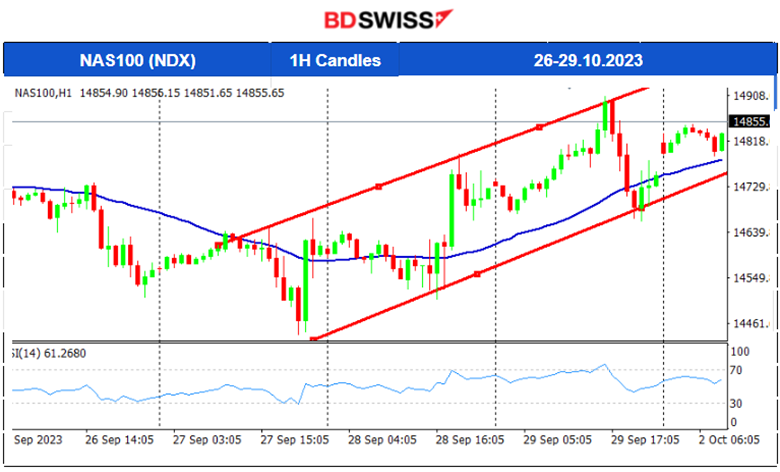
This week the index fell to its lowest at 14440 following a long period of a downward path. All benchmark indices were following the same path breaking more and more important support levels. Eventually the path changed and it coincided with the signals given by the RSI, of an oversold territory. On the 27th, the market reversed and started to move to the upside aggressively breaking resistance levels such as the 14660 showing a strong momentum upwards. It is more clear that the path remains on an upward channel. The other U.S. indices are facing slightly different paths, more sideways as it seems instead of upwards.
______________________________________________________________________
COMMODITIES MARKETS MONITOR
USOIL (WTI) 4-Day Chart Summary
Server Time / Timezone EEST (UTC 03:00)
Price Movement
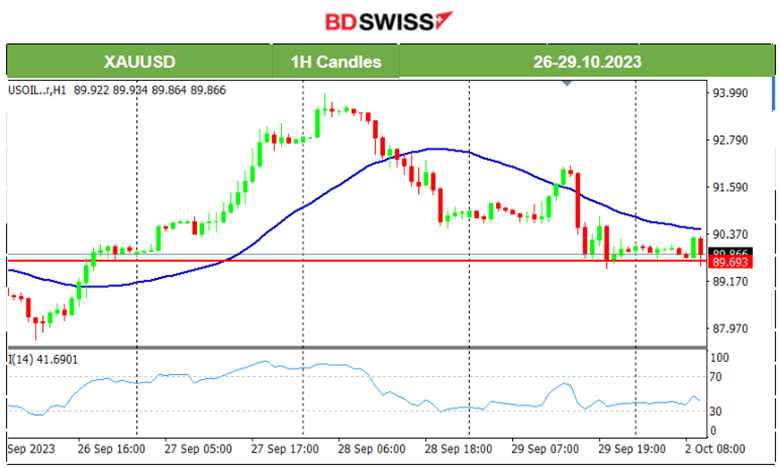
A strong resistance near 94 USD/b stopped Crude’s momentum and served as the end of the shock upwards. Soon a retracement followed with a drop reaching even below 91 USD/b on the 28th Sept. Crude’s price continued on the 29th Sept. to move with high volatility, breaking the support at near 90.5 USD/b and moving further to the downside. 89.70 USD/b serves now as an important support level.
XAUUSD (Gold) 4-Day Chart Summary
Server Time / Timezone EEST (UTC 03:00)
Price Movement
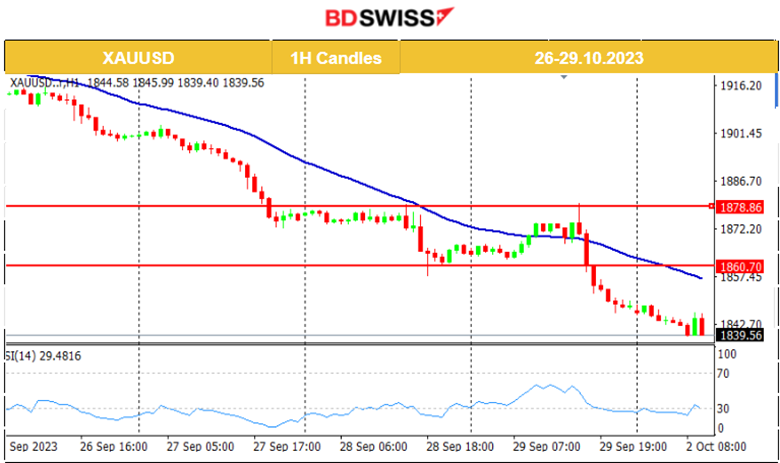
Gold has been moving to the downside significantly. It keeps on breaking important support levels while it is moving on a clear downtrend. Even though the RSI is slowing down staying close to the 30 level, there is no significant data to suggest that there will be a reversal or even halt.
______________________________________________________________
News Reports Monitor – Today Trading Day (02 October 2023)
Server Time / Timezone EEST (UTC 03:00)

- Midnight – Night Session (Asian)
No important news announcements. No special scheduled figure releases.
- Morning–Day Session (European and N. American Session)
PMIs for the Manufacturing sector are released today. It is expected that the market will experience more volatility than that of a typical Monday since these figures are important in shaping the picture regarding business conditions in the related region.
The U.S. ISM Manufacturing PMI figure is released at 17:00 and will potentially cause an intraday but small shock for the USD pairs.
Fed Chair Powell speaks at 18:00. The statements could increase volatility levels for the USD pairs and could push retracements to be completed.
General Verdict:
- Monday mood but PMIs could create more volatility than normal for FX pairs.
- Bitcoin and other cryptocurrencies jumped early this morning.
- Commodities on the downside.
- U.S. Indices halted the downside movement and remain resilient for now.
_____________________________________________________________
Source: BDSwiss