Fractal Analysis


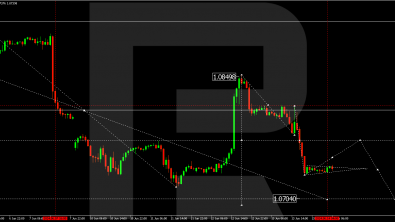
Technical Analysis & Forecast 14.06.2024
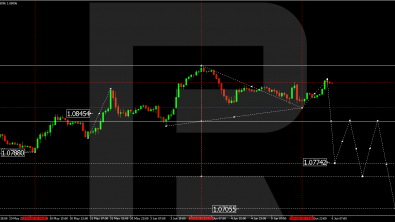
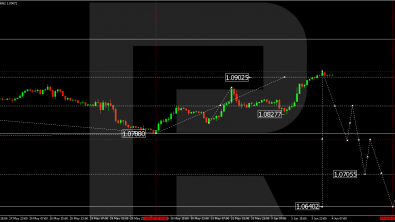
EURUSD, “Euro vs US Dollar” The EURUSD pair has completed a corrective wave, reaching 1.0814, and continued a decline wave. Today, the market is forming a narrow consolid...
Technical Analysis & Forecast 13.06.2024.
EURUSD, “Euro vs US Dollar” The EURUSD pair has exited the consolidation range upwards amid the news, practically forming a correction of the last decline wave, with a ta...
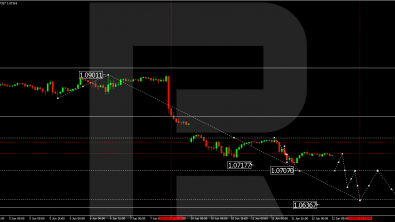
Technical Analysis & Forecast 12.06.2024
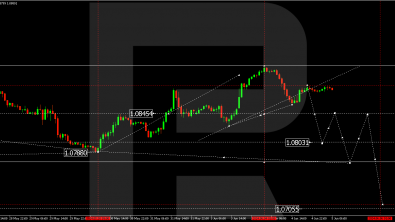
EURUSD, “Euro vs US Dollar” The EURUSD pair has completed a wave, reaching 1.0717. Practically, the market continues to develop a consolidation range around 1.0750. Today...
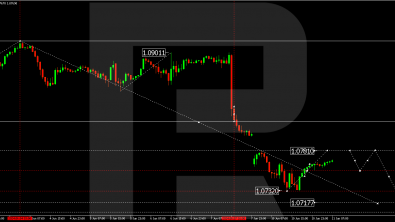
Technical Analysis & Forecast 11.06.2024
EURUSD, “Euro vs US Dollar” The EURUSD pair has completed a wave, reaching 1.0732, and started to form a consolidation range above this level. Today, the market has breac...
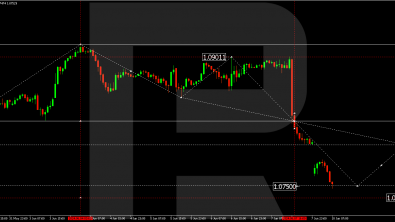
Technical Analysis & Forecast 10.06.2024
EURUSD, “Euro vs US Dollar” The EURUSD pair has completed a correction, reaching 1.0901, and initiated a new decline wave. A consolidation range formed around 1.0826 and,...
Technical Analysis & Forecast 07.06.2024
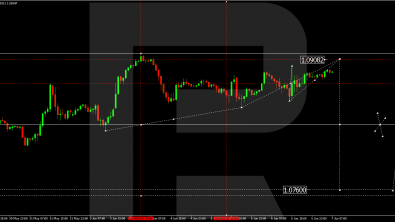
EURUSD, “Euro vs US Dollar” The EURUSD pair is currently in a consolidation phase around 1.0881, with the range potentially expanding towards 1.0909 today. After reaching...
Technical Analysis & Forecast 06.06.2024.
EURUSD, “Euro vs US Dollar” The EURUSD pair has completed a downward impulse towards 1.0854 and corrected towards 1.0893, with a consolidation range forming below this le...
Technical Analysis & Forecast 05.06.2024
EURUSD, “Euro vs US Dollar” The EURUSD pair has completed a downward impulse to 1.0858 and corrected towards 1.0886, with a consolidation range forming below this level t...
Technical Analysis & Forecast for June 2024
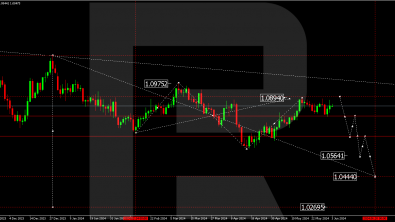
EURUSD, “Euro vs US Dollar” The EURUSD pair continues to develop a decline wave towards 1.0444, representing the estimated target. Another wave structure targeting 1.0607...
Technical Analysis & Forecast 04.06.2024
EURUSD, “Euro vs US Dollar” The EURUSD pair has completed a growth wave, reaching 1.0915. Today, a consolidation range is forming below this level. A downward breakout an...

Advantages of Fractal Analysis 

Fractal forex analysis is proved to be quite helpful in terms of foretelling the growth and the downfall of the price rates. Once you understand how it works, it will no longer cause difficulties – on the contrary, it will make your work easier and more effective. The correct use of the fractal analysis can make market behavior and the pricing a little more foreseeable.

The Essence of the Fractal Market Analysis

A Fractal is one of five indicators of Bill Williams’ trading system, which allows determining the bottom or the top. Fractal Technical Indicator is a set of at least five sequent bars. According to Williams, an "up fractal" or the “buy fractal” is defined as a middle bar with two lower highs on each side of it. A "down fractal", also known as the “sell fractal”, is a middle bar with two higher lows on each side of it. Fractals are valid up to the point that they are triggered, or there's a new fractal that appears in the same direction (in this case the previous signal has to be ignored and the pending order has to be deleted).

Using the fractal analysis

 As in everything we do, practice is the crucial part of the success. Therefore, it is advisable to learn how to generate small models. The second step would be the careful analysis of the external factors. Try to model a real market situation, predicting the further development. If if works, feel free to apply your skills to real trading.

For the successful fractal technical analysis remember the following:

  • It is wiser not to take trades before the first fractal is triggered
  • If the buy signal is above the Red Balance Line (the Alligator’s Teeth), place a buy stop one tick above the high of the up fractal.
  • If the sell signal is below the Red Balance Line, we would place a sell stop one tick below the low of the fractal sell signal.
  • Protective stops should be placed beneath the lowest low of the most recent Down Fractal

Fractals do not have predicative value for the price as they only follow it. Traders mostly use fractal analysis with other indicators to confirm that reversals have indeed occurred.

By visiting our website and services, you agree to the conditions of use of cookies. Learn more
I agree