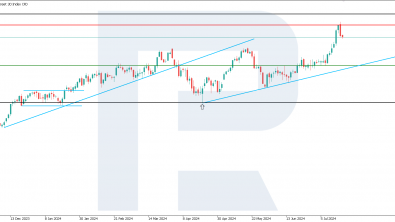
Defining Trend's Potential


The Trend Line Will Help to Create a Reliable Trading Strategy
Trend trading is a basis of most of strategies that are currently in use on the Forex market, so one of the sharpest questions nowadays is how to determine the trend, and specifically its direction at the selected time interval. To be fairly clued up of this issue it should be clear what the trend itself means and which factors does influence on its direction, as well as to understand some features of its move determination.
Purpose of the Trend Line
One of the simplest instruments in order to determine the trend's availability and its potential on the exchange market is the trend line. The trend lines will not only help you to determine the direction of the trend, but also to establish support and resistance levels. What is the purpose of the trend line? It shows you the last price movements, as well as instructs you regarding the future tendency of the market. Further, the trend line is a dynamic line of support in an uptrend and dynamic line of resistance in a downtrend. Average Directional Index (ADX) - is a popular technical indicator that is used to measure the direction and strength of the trend. Values above 30 on the ADX indicate the strong trend, while the value below 20 indicates flat market or absence of the trend. The higher the ADX (above 30) value, the stronger trend is.
The Trend Line Formation
Defining trend’s potential that is the main tendency of the market within a specific period of time, is the first step of the technical analysis. As we mentioned above, the trend could be the uptrend one, the downtrend and the sideways.
The trend lines could be formed if you connect two or more of maximum and minimum prices. The trend lines are required in order to determine the trend’s tendency, its reversal, as well as the support lines and resistance price. Support lines are conducted through local minimum, but resistance lines through local maximum.
The support line characterizes the level when buyers become stronger than sellers, but the resistance level vice-versa, when the sellers are at an advantage before the buyers.
The resistance and support lines define the price channels, within which the movement and fluctuation of the current trend price occurs.
When trading within the channel, the financial instruments should be bought at the local minimum, sold at the maximum, but in case of forecast appearance that the price will leave the channel limits, the player should do the opposite.
If the price crosses the line of the channel and extends for more than half of its current range, it means a signal for the forthcoming trend reversal.

